
9.15.26 Analyzing Impressive Margins
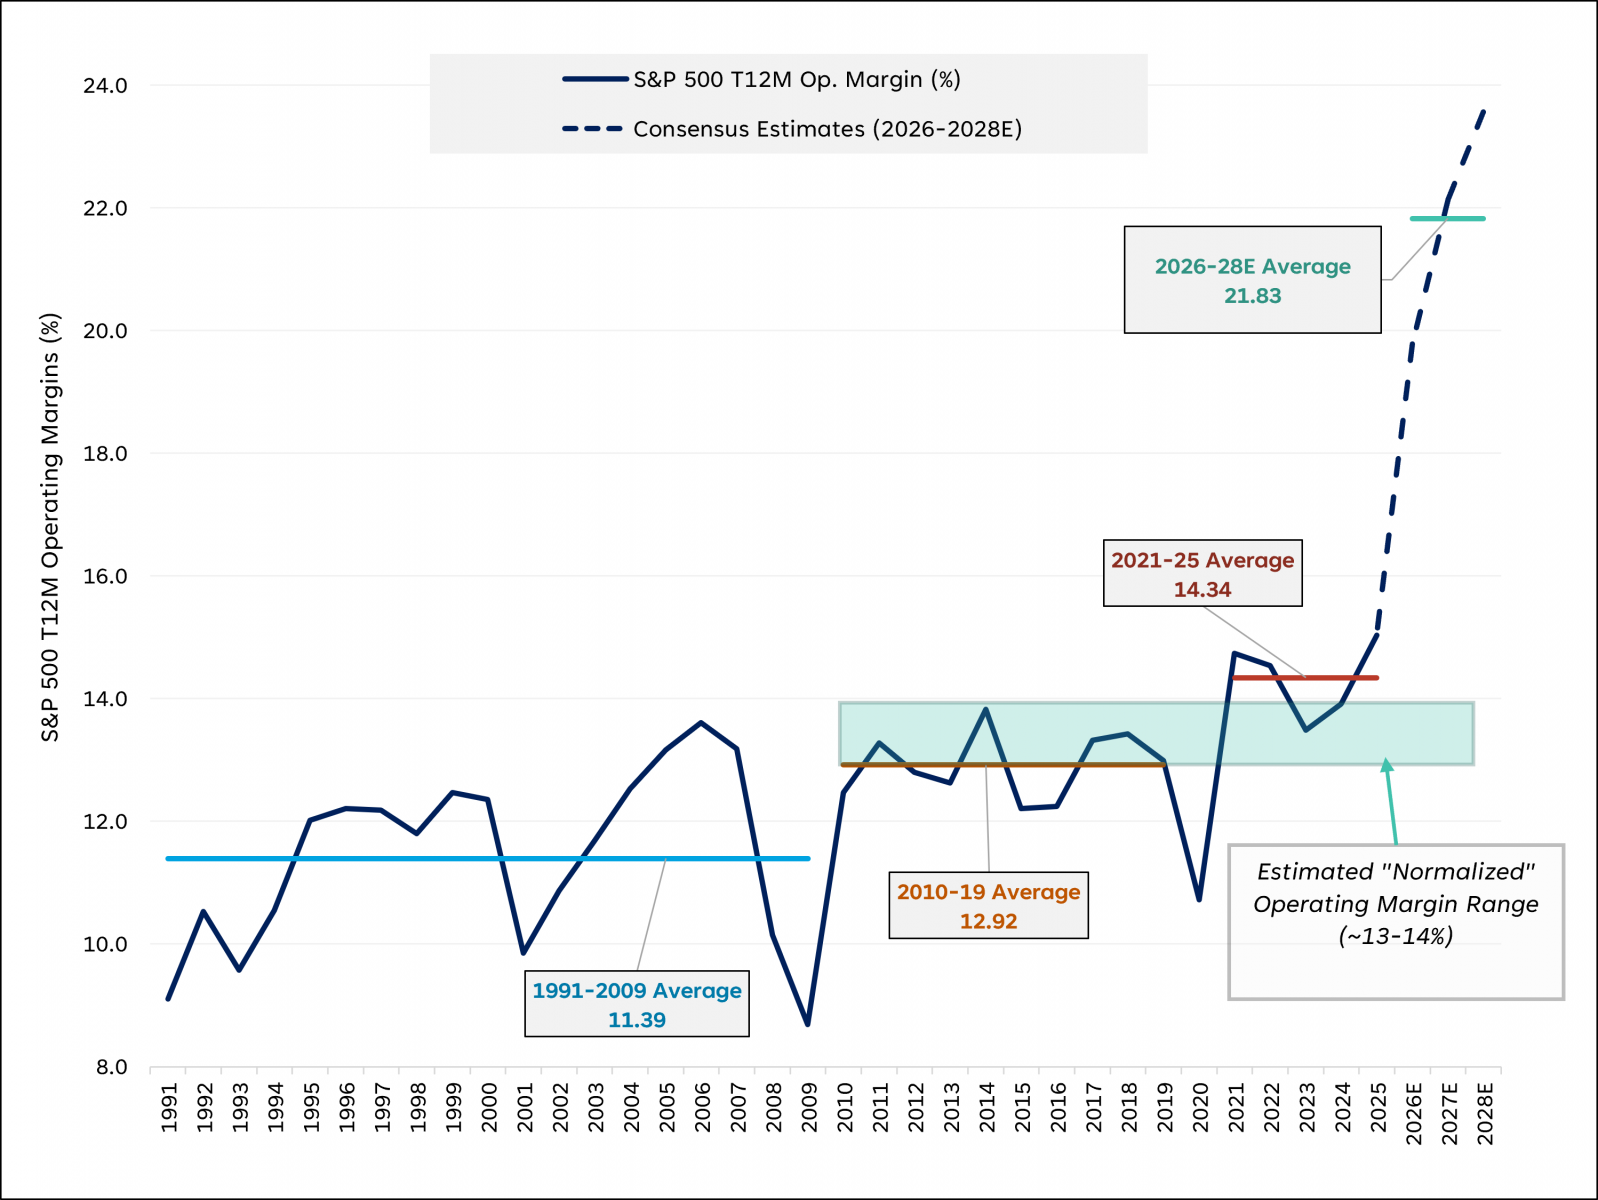
The S&P 500 index has seen impressive expansion in operating margins in recent years. Rolling back the clock, operating margins for the index averaged ~11.4% from 1991 through to 2009, with highwater marks set during the 90s and early 2000s notably below more recent averages. Structural drivers of expanding margins in the 90s included globalization, technology adoption, and the financialization of corporate America. Globalization allowed U.S. multinationals to shift labor-intensive manufacturing to lower-cost jurisdictions, compressing cost of goods sold while maintaining pricing power in domestic and developed markets. Supply chains became longer, leaner, and more profitable. Simultaneously, the early commercialization of the internet began rewiring how companies managed inventory, logistics, and customer acquisition — all with structurally lower marginal costs than the analog alternatives they replaced. The 1998 spike reflected the peak of dot-com optimism, with technology and telecom companies booking revenues against cost structures that had not yet caught up. It was a preview of what high-margin software economics could look like at scale, even if the valuations attached to those margins proved unsustainable.
The dot-com collapse pulled margins back sharply. A mid-cycle recovery followed, with margins climbing higher to 2006, supported by financial sector leverage, commodity-driven earnings, and continued offshoring. Then came the Global Financial Crisis, where margins collapsed in 2008.
What followed was arguably the most important structural shift in the entire series. From 2010 through 2019, S&P 500 margins settled into a remarkably stable and narrow band, averaging ~12.9%. This represents a decade of relatively normal operating conditions without the euphoria of a post-pandemic reopening or the distress of a financial crisis and is an appropriate baseline against which current margins should be judged. This was a consolidation at a structurally higher level than the pre-globalization era. The post-GFC decade was characterized by aggressive cost discipline, zero-interest-rate-enabled balance sheet optimization, and the accelerating shift of index composition toward asset-light, high-margin technology businesses.
S&P 500 Trailing 12 Month Operating Margins, Annual (1991–2028E)
- Source: LPL Research, Bloomberg 09/14/26
- Disclosures: Past performance is no guarantee of future results. All indexes are unmanaged and can’t be invested directly. Estimates may not realize as predicted and are subject to change.
Impact of the Technology Sector
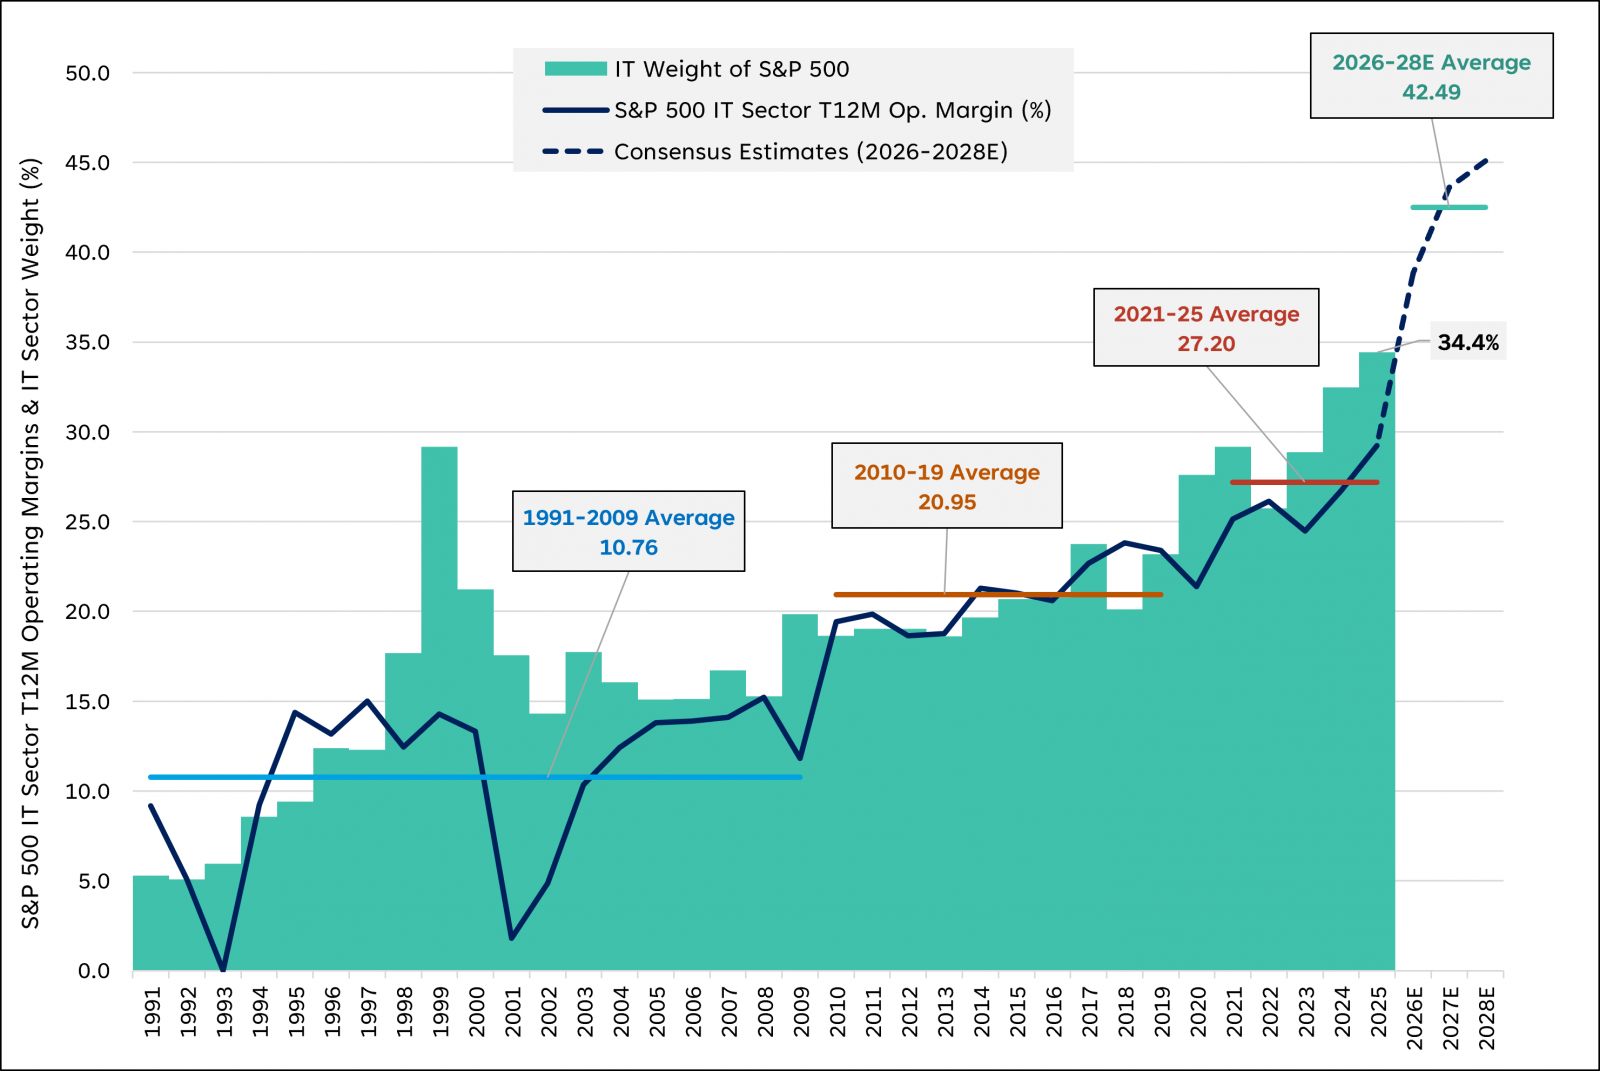
That last point is an important one as it helps to explain how current S&P 500 operating margins have gotten so strong. The technology sector index margin levels expanded to a record 29.2% in 2025 and 31.5% on a trailing 12-month basis as of the latest earnings reports. Furthermore, consensus estimates project margins will continue to climb sharply in 2027 and 2028. Margin expansion within the information technology sector was even more dramatic and reached higher highs than the broader S&P 500 index during the historical period analyzed (1991 to current). This margin expansion, in tandem with the sector’s growing weight in the index (from ~5.3% in 1991 to ~34.4% in 2025), has had an outsized impact on total margin expansion. Focusing on the latest margin step-up, the tech sector alone drove ~29% of the S&P 500 index margin expansion from 2019 to today. Drilling in further, the semiconductor industry drove roughly ~46% of the S&P 500 index margin expansion during the same timeframe. While semiconductors leading the broader technology sector and S&P 500 margins higher should come as no real surprise, the magnitude of semiconductors influence is worth keeping in mind. This analysis highlights just how much of the current and projected margins are reliant on a historically cyclical industry.
S&P 500 Information Technology Sector Trailing 12 Month Operating Margins, Annual (1991–2028E)
- Source: LPL Research, Bloomberg 09/14/26
- Disclosures: Past performance is no guarantee of future results. All indexes are unmanaged and can’t be invested directly. Estimates may not realize as predicted and are subject to change.
Conclusion
The S&P 500 is genuinely a higher-margin collection of businesses than it was in 1991, in 2000, or even in 2010. The technology sector's growth has permanently raised the index's margin potential. Looking long-term, we believe a "new normal" somewhere in the 13–14% range, above the 2010s average but below today's peak, is a defensible target for forward expectations. We view current projections anticipating further margin expansion from here as prone to disappointment, as we know that while some uplift in margins can be structural, we remain skeptical that current expectations are permanent. In other words, part of the margin series remains mean-reverting. Given current margin strength well above prior regime averages, current margins and forward expectations embed a cyclical premium that history suggests will not hold. That distinction matters for anyone looking to underwrite forward earnings and cash flow projections, a pre-requisite for uncovering the intrinsic value of a business.
-
Important Disclosures
-
This material is for general information only and is not intended to provide specific advice or recommendations for any individual. There is no assurance that the views or strategies discussed are suitable for all investors. To determine which investment(s) may be appropriate for you, please consult your financial professional prior to investing.
-
Investing involves risks including possible loss of principal. No investment strategy or risk management technique can guarantee return or eliminate risk.
-
Indexes are unmanaged and cannot be invested into directly. Index performance is not indicative of the performance of any investment and does not reflect fees, expenses, or sales charges. All performance referenced is historical and is no guarantee of future results.
-
This material was prepared by LPL Financial, LLC. All information is believed to be from reliable sources; however LPL Financial makes no representation as to its completeness or accuracy.
-
Unless otherwise stated LPL Financial and the third party persons and firms mentioned are not affiliates of each other and make no representation with respect to each other. Any company names noted herein are for educational purposes only and not an indication of trading intent or a solicitation of their products or services.
-
Asset Class Disclosures –
-
International investing involves special risks such as currency fluctuation and political instability and may not be suitable for all investors. These risks are often heightened for investments in emerging markets.
-
Bonds are subject to market and interest rate risk if sold prior to maturity.
-
Municipal bonds are subject and market and interest rate risk and potentially capital gains tax if sold prior to maturity. Interest income may be subject to the alternative minimum tax. Municipal bonds are federally tax-free but other state and local taxes may apply.
-
Preferred stock dividends are paid at the discretion of the issuing company. Preferred stocks are subject to interest rate and credit risk. They may be subject to a call features.
-
Alternative investments may not be suitable for all investors and involve special risks such as leveraging the investment, potential adverse market forces, regulatory changes and potentially illiquidity. The strategies employed in the management of alternative investments may accelerate the velocity of potential losses.
-
Mortgage backed securities are subject to credit, default, prepayment, extension, market and interest rate risk.
-
High yield/junk bonds (grade BB or below) are below investment grade securities, and are subject to higher interest rate, credit, and liquidity risks than those graded BBB and above. They generally should be part of a diversified portfolio for sophisticated investors.
-
Precious metal investing involves greater fluctuation and potential for losses.
-
The fast price swings of commodities will result in significant volatility in an investor's holdings.
-
This research material has been prepared by LPL Financial LLC.
-
Not Insured by FDIC/NCUA or Any Other Government Agency | Not Bank/Credit Union Deposits or Obligations | Not Bank/Credit Union Guaranteed | May Lose Value
-
For Public Use – Tracking: #1175093