
9.1.26 Weak September Seasonals Precede Strong Midterm Trends
Stocks have enjoyed a powerful run off the spring lows and have largely shrugged off concerns around growth, inflation, higher interest rates, the effects of artificial intelligence (AI), geopolitics, and policy uncertainty. As the calendar turns to September, however, they are entering what has historically been, from a seasonality perspective, the most challenging month of the year for equities.
So why does seasonality exist at all? A handful of recurring, calendar-driven behaviors tend to leave a footprint on returns: tax-related selling, mutual fund fiscal year-ends, corporate buyback windows, summer liquidity lulls, and the predictable rhythm of earnings season all nudge markets in loosely repeatable ways. That is why these patterns are worth watching; when a behavioral tendency persists across decades, it can offer a useful sense of the prevailing wind.
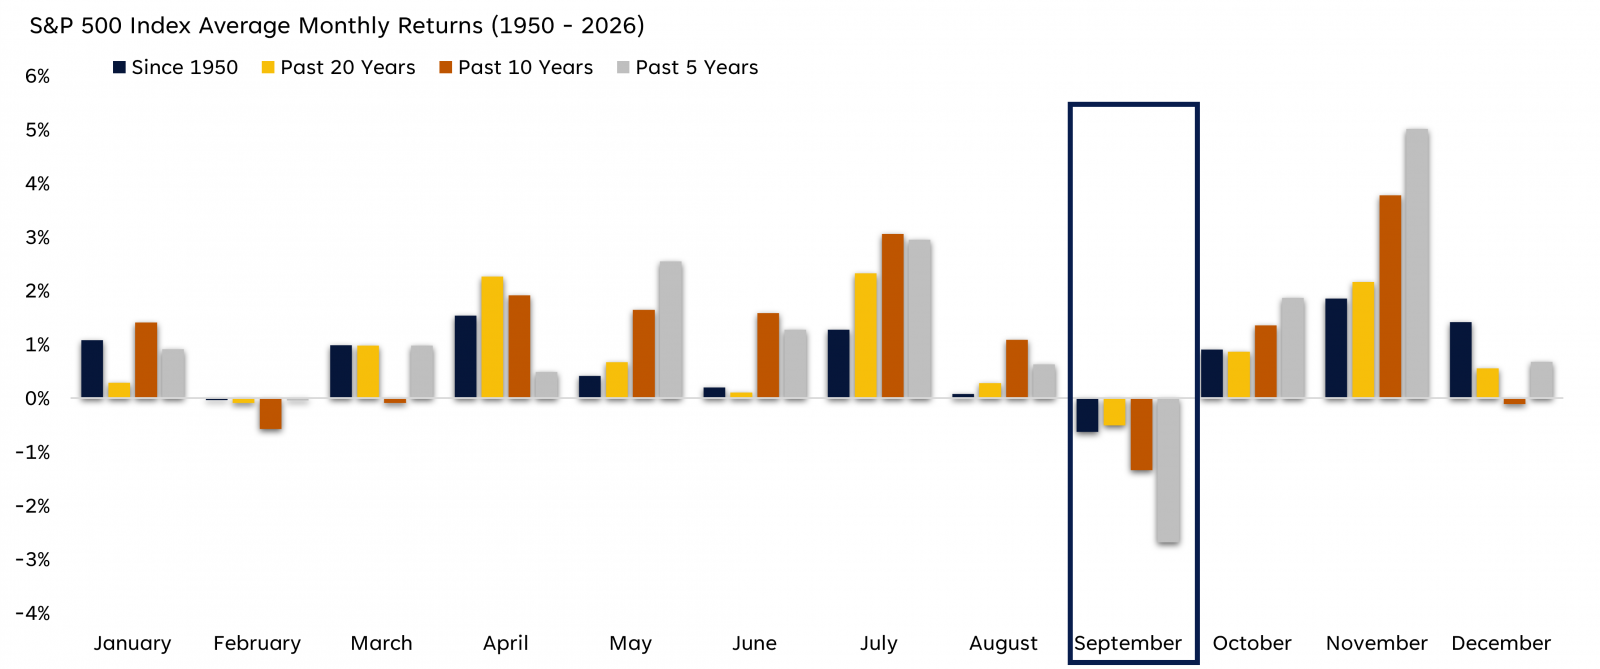
From a seasonality perspective, September has consistently stood out. Since 1950, it is the only month with a negative average return, at roughly -0.6%, and the S&P 500 has finished the month higher less than half the time. That weakness has been even more pronounced over the past five and 10 years, so the seasonal caution flag is a fair one to raise. Performance prior to 1957 is measured by the predecessor index, the S&P 90. Past performance does not guarantee future results.
Seasonality Trends Weaker for Equities in September
- Source: LPL Research, FactSet, Bloomberg 08/31/26 (1950–current).
- Disclosures: All indexes are unmanaged and cannot be invested into directly. Past performance is no guarantee of future results. The modern design of the S&P 500 Index was first launched in 1957. Performance before then incorporates the performance of its predecessor index, the S&P 90.
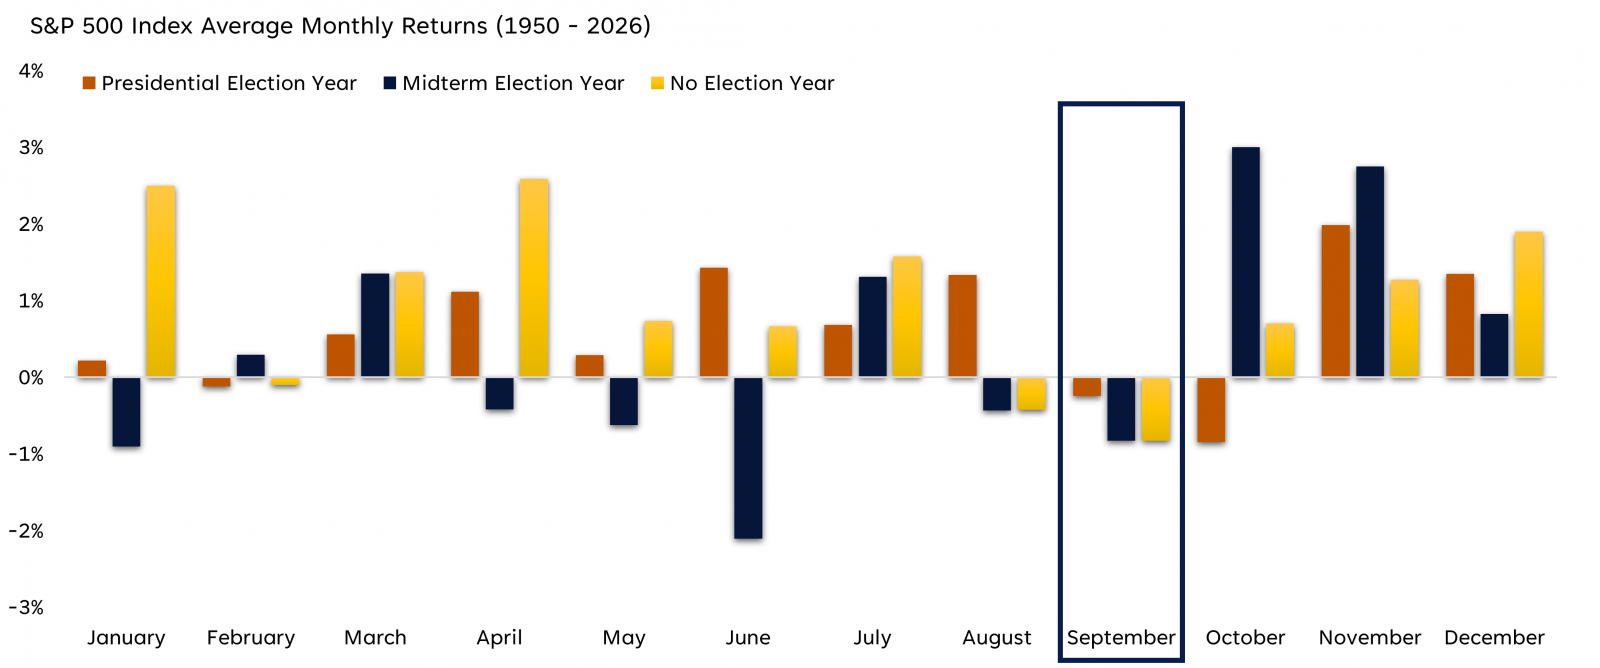
It is tempting to hope that a midterm election year offers some respite, but the data says otherwise. September in a midterm year has averaged about -0.8%, which is essentially identical to a typical non-election September and no better than the long-term norm. September, in other words, tends to be lackluster regardless of the political calendar. The last midterm September in 2022 was somewhat of a rout for the markets, with the S&P 500 shedding more than 9% due to fears over the Fed’s aggressive interest rate hiking campaign, high inflation, soaring Treasury yields, and mounting recession fears.
A more encouraging part of the midterm story is not September itself, but what has tended to follow. October has historically been the standout month in midterm years, averaging close to 3.0% returns, with November not far behind at 2.7%. Both dwarf the corresponding non-midterm year months and stacked together, the fourth quarter of a midterm year has been the strongest three-month stretch of the entire four-year presidential cycle. The pattern lines up with the idea that markets tend to firm up as election uncertainty begins to clear. Interestingly, the earlier turn in midterm-year performance in October, relative to a November bounce-back in Presidential election years, likely reflects a narrower, more benign range of outcomes; markets can begin pricing the all-clear ahead of the vote, whereas the higher stakes of a presidential election keep investors on the sidelines until the result is actually known.
Midterm Years Reshape the Seasonal Pattern
- Source: LPL Research, FactSet, Bloomberg 08/31/26 (1950–current).
- Disclosures: All indexes are unmanaged and cannot be invested into directly. Past performance is no guarantee of future results. The modern design of the S&P 500 Index was first launched in 1957. Performance before then incorporates the performance of its predecessor index, the S&P 90.
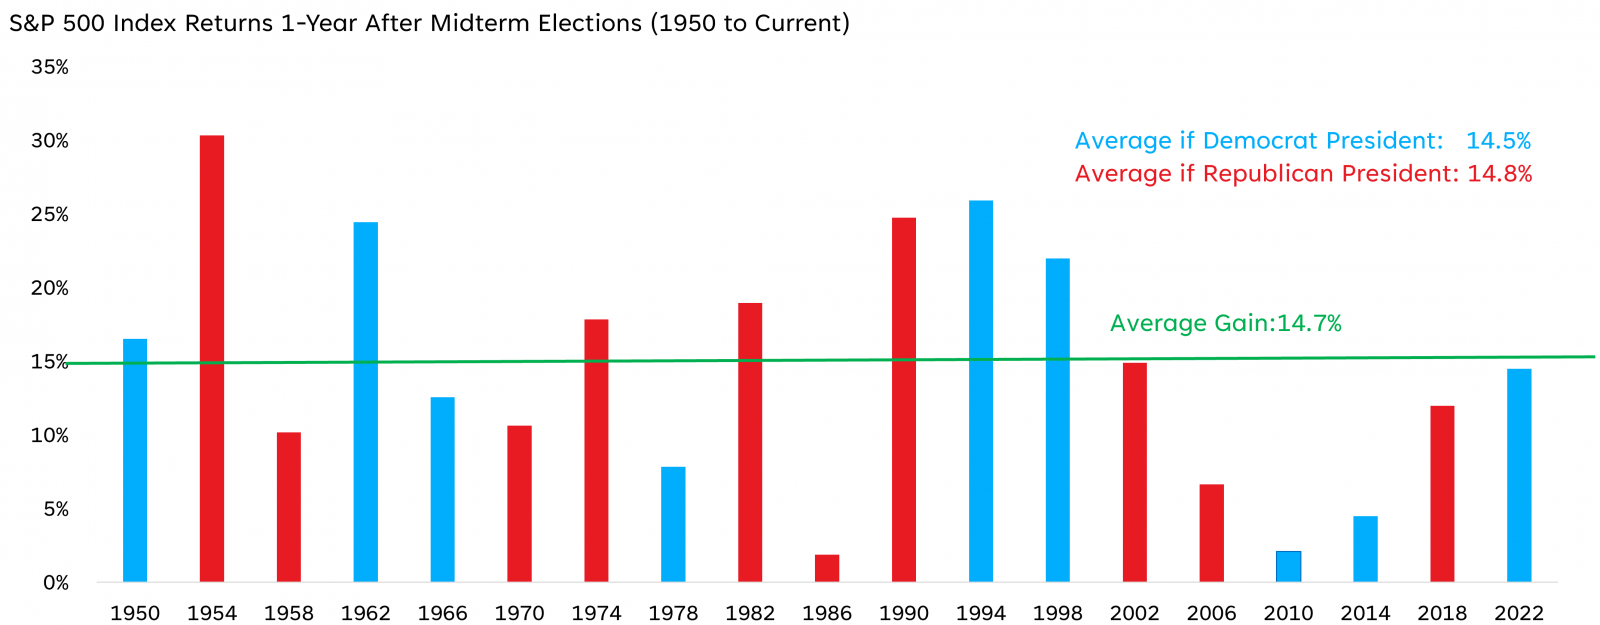
Importantly the improvement from October onwards in midterm years has not depended on which party holds the Presidency. Markets have generally responded more to the removal of uncertainty than to any specific result, and since 1950, stocks have been higher one year after every midterm election (19 in a row), with an average of almost 15%. Every cycle and environment is unique and history is a guide rather than a guarantee, but the tendency for stocks to strengthen once the midterms are in the rear-view mirror is strong and worth keeping in mind.
Stocks Have Gained a Year After Midterms (No Matter Who's in Office)
- Source: LPL Research, FactSet, Bloomberg 8/31/26 (1950–current).
- Disclosures: All indexes are unmanaged and cannot be invested into directly. Past performance is no guarantee of future results. The modern design of the S&P 500 Index was first launched in 1957. Performance before then incorporates the performance of its predecessor index, the S&P 90.
Investors should remember that seasonal and election-cycle patterns are averages, not forecasts, and averages can mask enormous dispersion between individual years. The sample is also statistically thin: with only 75 or so observations for the S&P 500 since 1950, a single outlier year can meaningfully skew the picture. Stock markets ultimately respond to earnings, economic data, monetary policy, and sentiment. With the Fed, the economy, and corporate earnings all still doing the heavy lifting, we would treat these trends as one piece of a broader framework rather than a signal to act on in isolation. Seasonality is best used as additional context for fundamentals, valuations, and the macro backdrop, but not the leading catalyst.
Conclusion and Asset Allocation Views
LPL's Strategic and Tactical Asset Allocation Committee (STAAC) maintains its recommendation for a tactical equity overweight and fixed income underweight. September has historically been the weakest month of the year, and midterm election years have been no exception, so we would not be surprised by some seasonal turbulence over the coming weeks. History suggests, however, that any September pullbacks often prove temporary, particularly heading into what has been the strongest stretch of the midterm cycle and the typically strong following year. We continue to believe an improving macro backdrop and sustained earnings growth support a constructive setup into the fourth quarter; and from a tactical perspective, we would view seasonal or election-related weakness as an opportunity to reassess positioning rather than a reason to become more defensive.
-
Important Disclosures
-
This material is for general information only and is not intended to provide specific advice or recommendations for any individual. There is no assurance that the views or strategies discussed are suitable for all investors. To determine which investment(s) may be appropriate for you, please consult your financial professional prior to investing.
-
Investing involves risks including possible loss of principal. No investment strategy or risk management technique can guarantee return or eliminate risk.
-
Indexes are unmanaged and cannot be invested into directly. Index performance is not indicative of the performance of any investment and does not reflect fees, expenses, or sales charges. All performance referenced is historical and is no guarantee of future results.
-
This material was prepared by LPL Financial, LLC. All information is believed to be from reliable sources; however LPL Financial makes no representation as to its completeness or accuracy.
-
Unless otherwise stated LPL Financial and the third party persons and firms mentioned are not affiliates of each other and make no representation with respect to each other. Any company names noted herein are for educational purposes only and not an indication of trading intent or a solicitation of their products or services.
-
Asset Class Disclosures –
-
International investing involves special risks such as currency fluctuation and political instability and may not be suitable for all investors. These risks are often heightened for investments in emerging markets.
-
Bonds are subject to market and interest rate risk if sold prior to maturity.
-
Municipal bonds are subject and market and interest rate risk and potentially capital gains tax if sold prior to maturity. Interest income may be subject to the alternative minimum tax. Municipal bonds are federally tax-free but other state and local taxes may apply.
-
Preferred stock dividends are paid at the discretion of the issuing company. Preferred stocks are subject to interest rate and credit risk. They may be subject to a call features.
-
Alternative investments may not be suitable for all investors and involve special risks such as leveraging the investment, potential adverse market forces, regulatory changes and potentially illiquidity. The strategies employed in the management of alternative investments may accelerate the velocity of potential losses.
-
Mortgage backed securities are subject to credit, default, prepayment, extension, market and interest rate risk.
-
High yield/junk bonds (grade BB or below) are below investment grade securities, and are subject to higher interest rate, credit, and liquidity risks than those graded BBB and above. They generally should be part of a diversified portfolio for sophisticated investors.
-
Precious metal investing involves greater fluctuation and potential for losses.
-
The fast price swings of commodities will result in significant volatility in an investor's holdings.
-
This research material has been prepared by LPL Financial LLC.
-
Not Insured by FDIC/NCUA or Any Other Government Agency | Not Bank/Credit Union Deposits or Obligations | Not Bank/Credit Union Guaranteed | May Lose Value
-
For Public Use – Tracking: #1167872