6.3.26 Equity Record Highs Shape May Fund Flows
With May behind us, we conducted a deep dive into exchange-traded fund (ETF) flows over the month and year-to-date (YTD) periods. Flows measure the net movement of cash into and out of investment vehicles, such as mutual funds and ETFs. We analyzed flows to gain insight on investor demand and sentiment surrounding asset classes, sectors, and other segments of markets.
Broad Asset Class Flows
Global markets in May continued a broad risk-on tone, with equities closing the month at record highs on resilient growth and strong artificial intelligence (AI)-driven earnings, despite ongoing geopolitical uncertainty and persistent inflation. Bond yields moved higher as oil prices remained at multi-year highs, leading investors to scale back expectations for rate cuts by year-end — even as a new Federal Reserve (Fed) Chair was sworn in late in the month. Outside of traditional assets, capital continued to flow into private markets and AI-linked infrastructure, while commodities and currencies remained closely tied to energy dynamics, reinforcing the increasingly interconnected nature of the macro landscape.
The ETF market climbed to a record $15.7 trillion in assets in May, with both strong inflows and market performance contributing to the milestone. Equity ETFs drove the bulk of demand with $134 billion of inflows, followed by fixed income at $62 billion, and alternatives at $4.3 billion. Currency ETFs were the only asset class to experience outflows, with a net outflow of $2.5 billion, driven largely by cryptocurrency — while not a traditional fiat currency — as higher interest rates and strong equity returns reduced the relative appeal of crypto assets.
For the year-to-date (YTD) period, ETFs gathered $832 billion in assets, with roughly two-thirds of that capital flowing into equity ETFs. Equities now represent nearly 80% of total ETF market share, up marginally from 79% at the end of April. The combination of stellar performance and risk-on investor sentiment contributed to the surge in asset growth. Bonds make up another 16% of the total ETF market share, with their relative share marginally decreasing. Combined, stock and bond ETFs represent more than 95% of the ETF industry. Outside of traditional asset classes, commodities represent roughly 2.3% of remaining ETF assets or $353 billion, followed by alternatives ($138 billion), currency ($119 billion), and asset allocation strategies ($45 billion). While commodities experienced net outflows during the month, all other segments saw net inflows, and every asset class has recorded positive net inflows year to date.
Trend Intact: Equities Continue to Dominate May Flows
Trailing one-month, YTD, and one-year net asset flows across broad asset classes (AUM, Billions $)
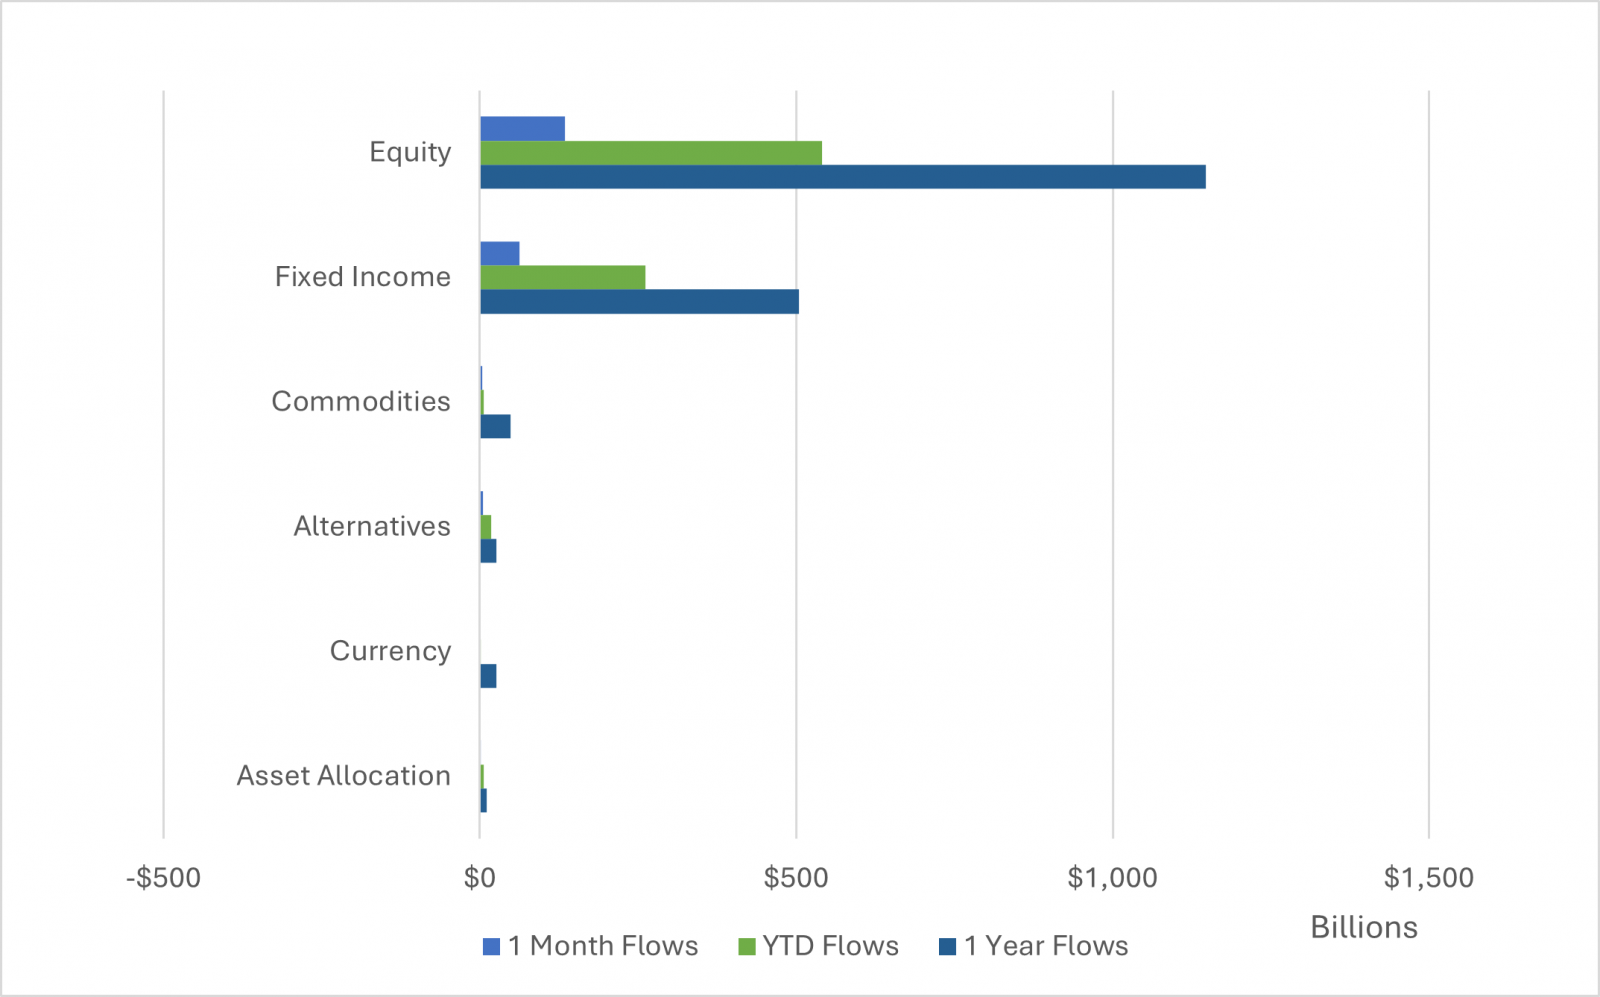
- Source: LPL Research, FactSet 05/29/26
- Disclosures: Past performance is no guarantee of future results.
Asset Class Specific Flows
Equities: Within equities, U.S. large caps continued to dominate by a wide margin, attracting $77 billion — more than half of all equity inflows and nearly ten times the next-largest category. Flows into ultra-short Treasury ETFs followed distantly at $7.5 billion. Investors remained heavily tilted toward U.S. equities, supported by their relative insulation from Middle East geopolitical tensions and sustained AI-driven growth tailwinds. Other domestic segments also saw modest demand, with large cap growth and total market ETFs gathering $4.6 billion and $4.5 billion, ranking sixth and seventh, respectively. Large caps continued to outpace small caps significantly, reflecting not only their larger market footprint but also stronger performance, as the Nasdaq Composite Index (+8.4%) and S&P 500 (+5.3%) outpaced the Russell 2000 (+4.4%).
Outside of U.S. equities, global ex-U.S. total market and global semiconductor segments ranked third and fourth, respectively, in May inflows across all asset classes. Emerging market equities, ranking fifth largest by flows YTD, have been the top regional performer (relative to domestic and developed ex-U.S. equities), rising 25.6%. The rally has been driven by a shift in leadership toward technology-heavy markets, such as Taiwan and South Korea, displacing prior leaders China and India. Taiwan leads global semiconductor manufacturing, while South Korea is a key supplier of memory chips essential for AI systems — positioning both as critical pillars of the AI supply chain and supporting infrastructure.
Despite South Korea benefitting tremendously from AI tailwinds, and its equity market more than doubling so far in 2026, South Korea equity ETFs were the top segment by outflows in May, shedding $2.8 billion. The country’s equity market is effectively a concentrated AI play, with the two largest components, Samsung and SK Hynix, comprising nearly half of the index. This level of concentration has left some investors increasingly cautious, raising concerns around concentration risk, valuation sensitivity, and the sustainability of returns tied so heavily to a single theme.
Fixed Income: In fixed income, ultra-short Treasury ETFs, highlighted earlier, ranked as the second-largest segment across asset classes by inflows, drawing $7.6 billion in May. Despite the broader risk-on backdrop, these traditionally defensive, cash-like instruments still attracted significant demand. The coexistence of strong inflows into both U.S. large caps (the top segment by inflows) and ultra-short Treasuries, alongside outflows from South Korean equities (the top segment by outflows), underscores a more nuanced market dynamic, as investors balanced participation in equity upside with liquidity needs and downside protection, while also rotating away from more concentrated or fully valued risk exposures. Following ultra-short Treasuries were investment-grade bonds and global bonds, ranking fifth and eighth, respectively.
While investor sentiment remained broadly positive, no fixed income segments appeared among the top 10 categories by outflows in May. Long-duration Treasury bonds were a notable laggard, declining over the month as expectations for persistently higher inflation and interest rates weighed on longer-term return prospects. In the YTD period, long-dated Treasuries ranked as the third largest segment by outflows ($5 billion), further highlighting the risk duration may play in portfolios at the prospect of higher rates.
Diversifying Strategies: Across diversifying strategies, gold ETFs saw a meaningful outflow in May at $1.5 billion, ranking sixth among asset classes. Gold’s relative appeal dissipated as geopolitical tensions continued to ease and equities moved higher. Gold and silver, two of the largest components of the commodities markets, rank in the top five in terms of outflows YTD as investors dump these traditionally defensive, safe-haven assets for global equities. Flows into oil and gas ETFs remained relatively muted despite prices holding at multi-year highs, suggesting investors viewed these elevated energy prices as potentially the peak.
While small in size (0.9%), alternatives broadly have seen positive flows, with traditional hedge fund strategies, such as global macro, event driven, and managed futures, which are now being offered in ETF vehicles (although with stringent restrictions to stay within regulatory compliance), continue to gain assets. Collectively, these alternative strategies can be seen as defensive positions that offer uncorrelated return streams to traditional equities and fixed income.
U.S Large Cap Catapults to Top Segment by 2026 Flows
Trailing YTD net asset flows across FactSet segments (AUM, $ Billions)
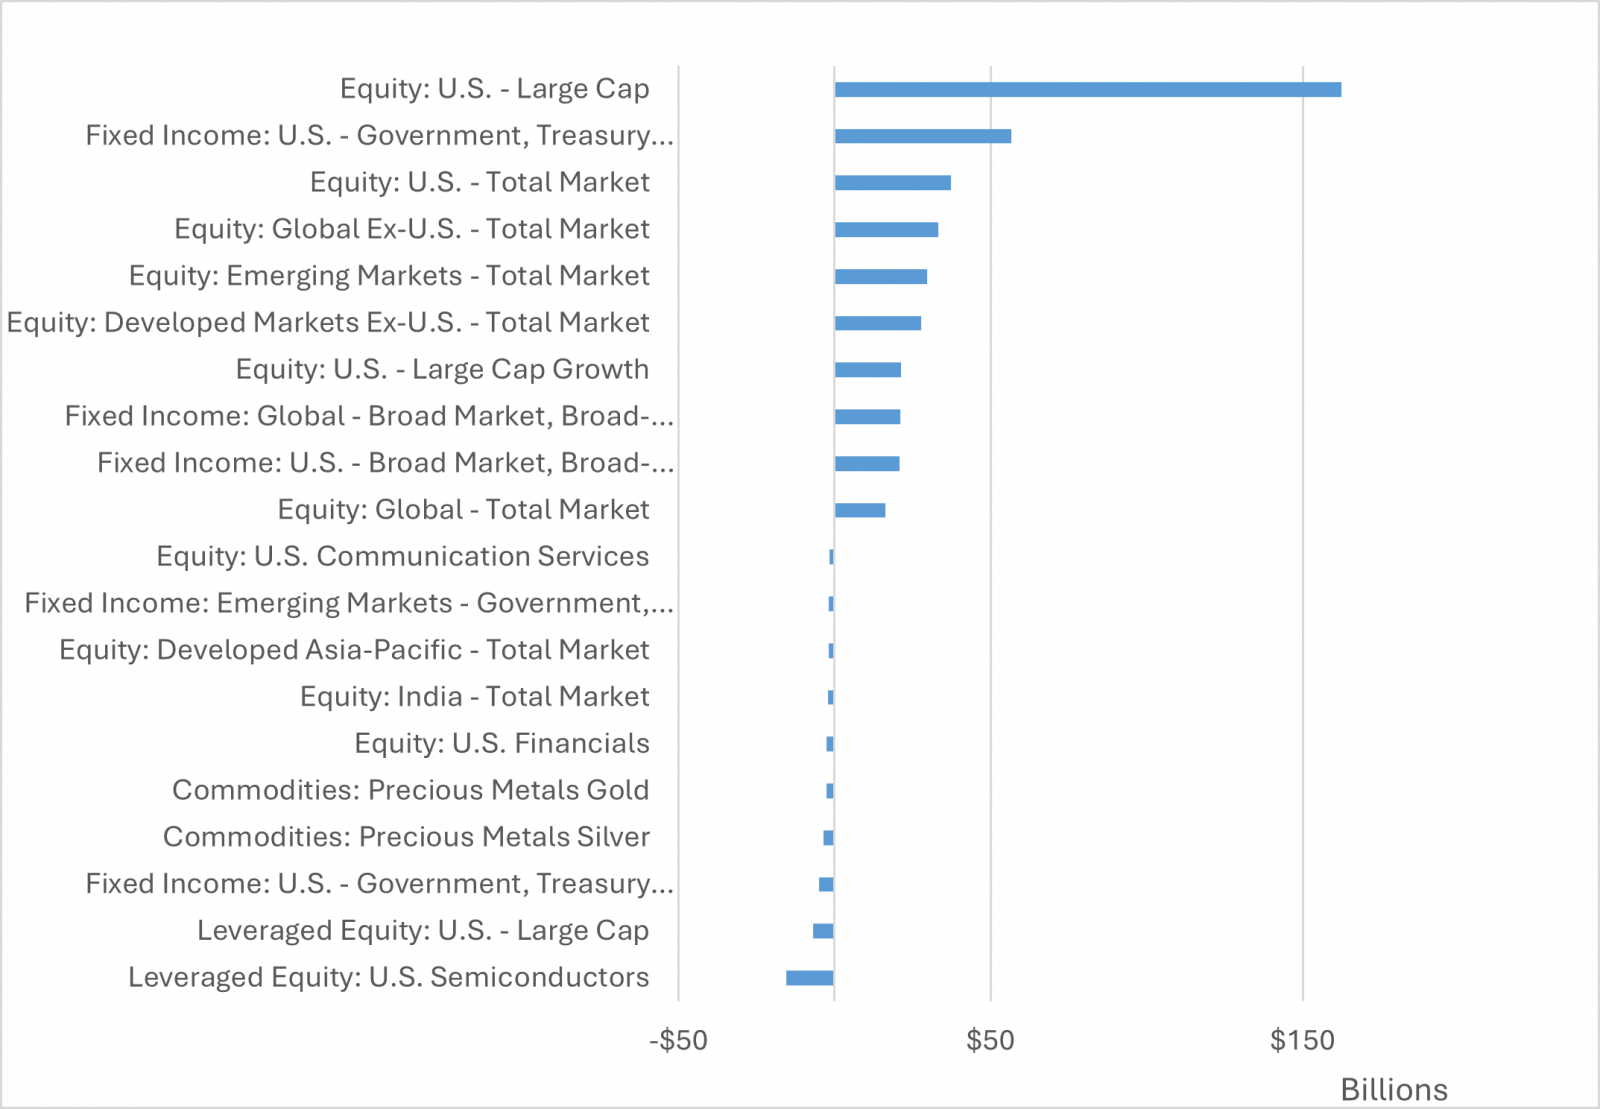
- Source: LPL Research, FactSet 05/29/26
- Disclosures: Past performance is no guarantee of future results.
Key Tactical Asset Allocation Takeaways
When comparing the latest LPL Research Strategic and Tactical Asset Allocation Committee (STAAC) views with the May flows data, there are a number of similarities. The STAAC continues to like the top asset class by assets and largest by YTD flows, U.S. large caps. The STAAC maintains a slight overweight to large/mid cap equities, with a modest tilt towards large/mid growth, which continues to benefit from sentiment surrounding AI and strong technology-driven earnings growth. Regionally, the STAAC had been warming up to the fifth-highest segment by flows YTD, emerging market equities, on improving fundamentals and technicals, but remains neutral from a geographic perspective within foreign equities given how much the asset class has run and maintains a slight bias towards the U.S.
Within fixed income, the STAAC prefers core bond sectors over spread sectors as historically tight spreads make the relative risk-return profile of spread sectors less attractive. Outside of traditional stocks and bonds, the STAAC maintains an allocation to alternative investments, specifically in global macro and multi-strategy funds.
-
Important Disclosures
-
This material is for general information only and is not intended to provide specific advice or recommendations for any individual. There is no assurance that the views or strategies discussed are suitable for all investors. To determine which investment(s) may be appropriate for you, please consult your financial professional prior to investing.
-
Investing involves risks including possible loss of principal. No investment strategy or risk management technique can guarantee return or eliminate risk.
-
Indexes are unmanaged and cannot be invested into directly. Index performance is not indicative of the performance of any investment and does not reflect fees, expenses, or sales charges. All performance referenced is historical and is no guarantee of future results.
-
This material was prepared by LPL Financial, LLC. All information is believed to be from reliable sources; however LPL Financial makes no representation as to its completeness or accuracy.
-
Unless otherwise stated LPL Financial and the third party persons and firms mentioned are not affiliates of each other and make no representation with respect to each other. Any company names noted herein are for educational purposes only and not an indication of trading intent or a solicitation of their products or services.
-
Asset Class Disclosures –
-
International investing involves special risks such as currency fluctuation and political instability and may not be suitable for all investors. These risks are often heightened for investments in emerging markets.
-
Bonds are subject to market and interest rate risk if sold prior to maturity.
-
Municipal bonds are subject and market and interest rate risk and potentially capital gains tax if sold prior to maturity. Interest income may be subject to the alternative minimum tax. Municipal bonds are federally tax-free but other state and local taxes may apply.
-
Preferred stock dividends are paid at the discretion of the issuing company. Preferred stocks are subject to interest rate and credit risk. They may be subject to a call features.
-
Alternative investments may not be suitable for all investors and involve special risks such as leveraging the investment, potential adverse market forces, regulatory changes and potentially illiquidity. The strategies employed in the management of alternative investments may accelerate the velocity of potential losses.
-
Mortgage backed securities are subject to credit, default, prepayment, extension, market and interest rate risk.
-
High yield/junk bonds (grade BB or below) are below investment grade securities, and are subject to higher interest rate, credit, and liquidity risks than those graded BBB and above. They generally should be part of a diversified portfolio for sophisticated investors.
-
Precious metal investing involves greater fluctuation and potential for losses.
-
The fast price swings of commodities will result in significant volatility in an investor's holdings.
-
This research material has been prepared by LPL Financial LLC.
-
Not Insured by FDIC/NCUA or Any Other Government Agency | Not Bank/Credit Union Deposits or Obligations | Not Bank/Credit Union Guaranteed | May Lose Value
-
For Public Use – Tracking: #1116028