5.7.26 April Rotation: U.S. Large Caps Regain Dominance
With April behind us, we conducted a deep dive into exchange-traded fund (ETF) flows over the month and year-to-date (YTD) periods. Flows measure the net movement of cash into and out of investment vehicles, such as mutual funds and ETFs. We analyzed flows to gain insight on investor demand and sentiment surrounding asset classes, sectors, and other segments of markets.
Broad Asset Class Flows
Following a global market sell-off in March, risk assets surged in April, with most equity categories posting double-digit gains. Easing geopolitical tensions and lower oil prices helped stabilize sentiment, allowing investors to refocus on corporate earnings. Quarterly results have generally exceeded expectations, with the Magnificent (Mag) Seven delivering strong performances and issuing guidance that continues to support optimism around the artificial intelligence (AI) theme. Bond yields declined as concerns about persistent inflation driven by the spike in oil prices dissipated.
The ETF market gained $1.4 trillion in assets from a combination of flows and performance, ending April at $14.9 trillion. Equities saw the largest inflow at $133 billion, followed by fixed income ($33 billion) and alternative investments ($4 billion). The only asset class to experience an outflow over the month was commodities, with a net outflow of $1.6 billion. One of the largest segments within commodities is oil. As tensions between the U.S. and Iran have eased — reducing concerns of a prolonged disruption in the Strait of Hormuz, a critical passage for roughly 20% of global oil supply — oil prices have pulled back significantly from their multi-year highs, leading to an outflow in broad-based and oil-specific commodity ETFs.
For the year-to-date (YTD) period, ETFs gathered $641 billion in assets, with roughly two-thirds of that capital flowing into equity ETFs. Equities now represent nearly 79% of total ETF market share, up from roughly 77% at the end of the first quarter. The combination of stellar performance and risk-on investor sentiment contributed to the surge in asset growth to end April. Bonds make up another 17% of the total ETF market share, with their relative share marginally decreasing. Combined, stock and bond ETFs represent more than 95% of the ETF industry. Outside of traditional asset classes, such as stocks and bonds, commodities represent roughly 2.5% of remaining ETF assets or $365 billion, followed by alternatives ($132 billion), currency ($128 billion), and asset allocation strategies ($43 billion). While commodities experienced net outflows during the month, all other segments saw net inflows, and every asset class has recorded positive net inflows year to date.
Risk-On Sentiment Returns: Equities Dominate April Flows
Trailing one-month, YTD, and one-year net asset flows across broad asset classes (AUM, Billions $)
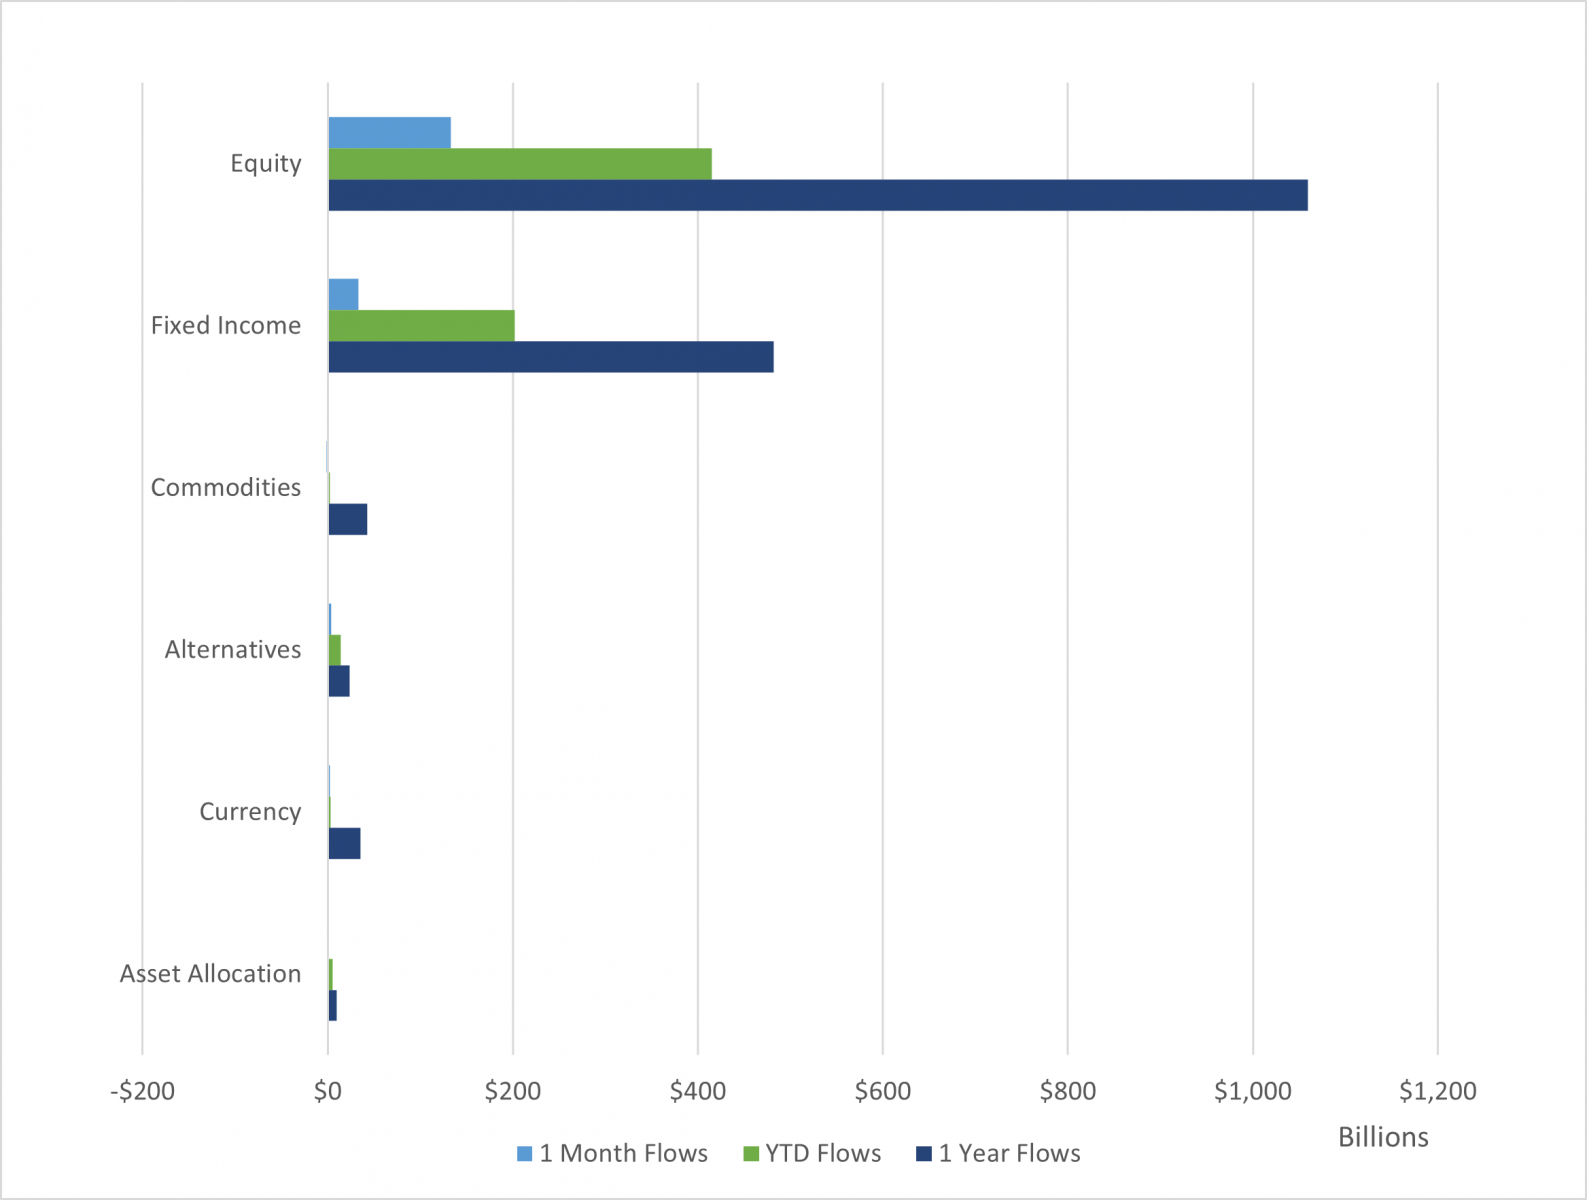
- Source: LPL Research, FactSet 04/30/26
- Disclosures: Past performance is no guarantee of future results.
Asset Class Specific Flows
Equities: Within equities, domestic segments dominated monthly flows, with U.S. large cap, U.S. total market, and U.S. large growth rounding out three of the top four segments by flows. Broad U.S. large cap equity ETFs saw an astounding $72 billion in flows, more than seven times the next closest segment, U.S. total market. With hostilities easing in the Middle East and earnings estimates ticking higher, investors turned their focus back to the leading market tailwind, AI, and how its transformation and buildout is impacting the broader economy. Given their concentration in U.S. large cap indexes, representing roughly 30% of the S&P 500, investors can gain exposure to the Mag Seven by simply purchasing broad-based U.S. ETFs, which is what we saw in April with large cap, total market, and large cap growth gathering a little over $86 billion — representing nearly two-thirds of total ETF flows. Looking more specifically at the main input driving AI transformation, the third largest segment by flows over the month was global semiconductors, experiencing a nearly $6 billion inflow.
While U.S. equity ETFs gathered most of the capital this month, global and developed ex-U.S. markets continued to realize net inflows, with global total market, global ex-U.S. total market, and developed markets ex-U.S. ranking fifth, seventh, and ninth, respectively, in monthly flows. Foreign equities still outpaced domestic in performance over the YTD period, with emerging markets realizing a total return of nearly 15%.
At the other end of the spectrum, leveraged ETFs and ETFs predominantly comprised of oil stocks, saw meaningful outflows, with leveraged semiconductors and leveraged U.S. large caps experiencing outflows of $11 billion and $5.2 billion, respectively. Despite the rally in equities, investors continue to dump leveraged equity ETFs in favor of unleveraged, with both categories also the leading segments by outflows YTD. Given recent volatility in March — and even significant volatility in April 2025 — market participants may be looking for a smoother ride in stocks given leverage amplifies the magnitude of returns, positive and negative. Another notable segment that realized an outflow in April was U.S. small cap equities, losing $724 million in assets. YTD flows remain moderately positive (just above $1 billion), despite being one of the top-performing asset classes in 2026, with the Russell 2000 up over 13%. Although small cap equities have recently outperformed their large cap peers, they offer less direct exposure to AI. With AI back in focus — driven by its prominence in earnings and its broader economic impact — investors appear to have rotated out of small caps and into large caps over the month.
Fixed Income: In fixed income, the ultra-short Treasury segment was the third largest segment across asset classes (equity, fixed income, alternatives, etc.) by outflows, following a March in which they were the top asset-gatherer in a down market. Ultra-short Treasuries saw an outflow of $2.5 billion; however, they remained the second largest segment by flows YTD, gathering $47 billion. The next largest bond segment by outflows was floating rate investment-grade Treasuries, which saw an outflow of $778 million.
As previously mentioned, bonds broadly saw significant inflows in April, with more credit-sensitive sectors, such as high-yield and global bonds, realizing $3.9 billion and $3.2 billion in inflows, respectively. Like equity investors, bond investors rotated out of more conservative segments (ultra-short Treasuries) in March and into more aggressive sectors, with global bond markets entering the top 10 segments by flows YTD, gathering $17 billion. The appetite for fixed income remains healthy given the choppy environment in equities over the past 16 months and the ever-changing geopolitical landscape. While spreads remain tight in credit sectors, all-in yields remain attractive and fixed income continues to offer diversification benefits in a global multi-asset portfolio.
Diversifying Strategies: Across diversifying strategies, commodity ETFs, specifically those focused on oil, experienced the biggest outflows among diversifying strategies in April, losing $1.5 billion. As discussed earlier, oil prices came off multi-year highs, leading to a sell-off in the energy sector and those thematic ETFs tied to oil. With potential resolution on the horizon in the Middle East, performance may have peaked in this segment. Also, within commodities, silver continued to rank in the top 10 (fourth across asset classes) by outflows YTD, having lost $2.4 billion. Gold, on the other hand, realized an inflow in April ($329 million) but remains negative YTD ($1.3 billion). Gold sold off in March, along with equities and fixed income, and failed to climb back to its all-time highs as investors rotated more into growth-oriented assets, given easing inflation fears, lower geopolitical risk, and renewed enthusiasm around AI.
While small in size (0.9%), alternatives broadly have seen positive flows, with downside risk mitigation ETFs, also referred to as “buffer” ETFs, becoming more popular among investors as they try to protect their portfolios from drawdown risk with heightened volatility. Additionally, traditional hedge fund strategies, such as global macro, event driven, and managed futures, which are now being offered in ETF vehicles (although with stringent restrictions to stay within regulatory compliance), continue to gain assets. Collectively, these alternative strategies can be seen as defensive positions that offer uncorrelated return streams to traditional equities and fixed income.
U.S Large Cap Catapults to Top Segment by 2026 Flows
Trailing YTD net asset flows across FactSet segments (AUM, $ Billions)
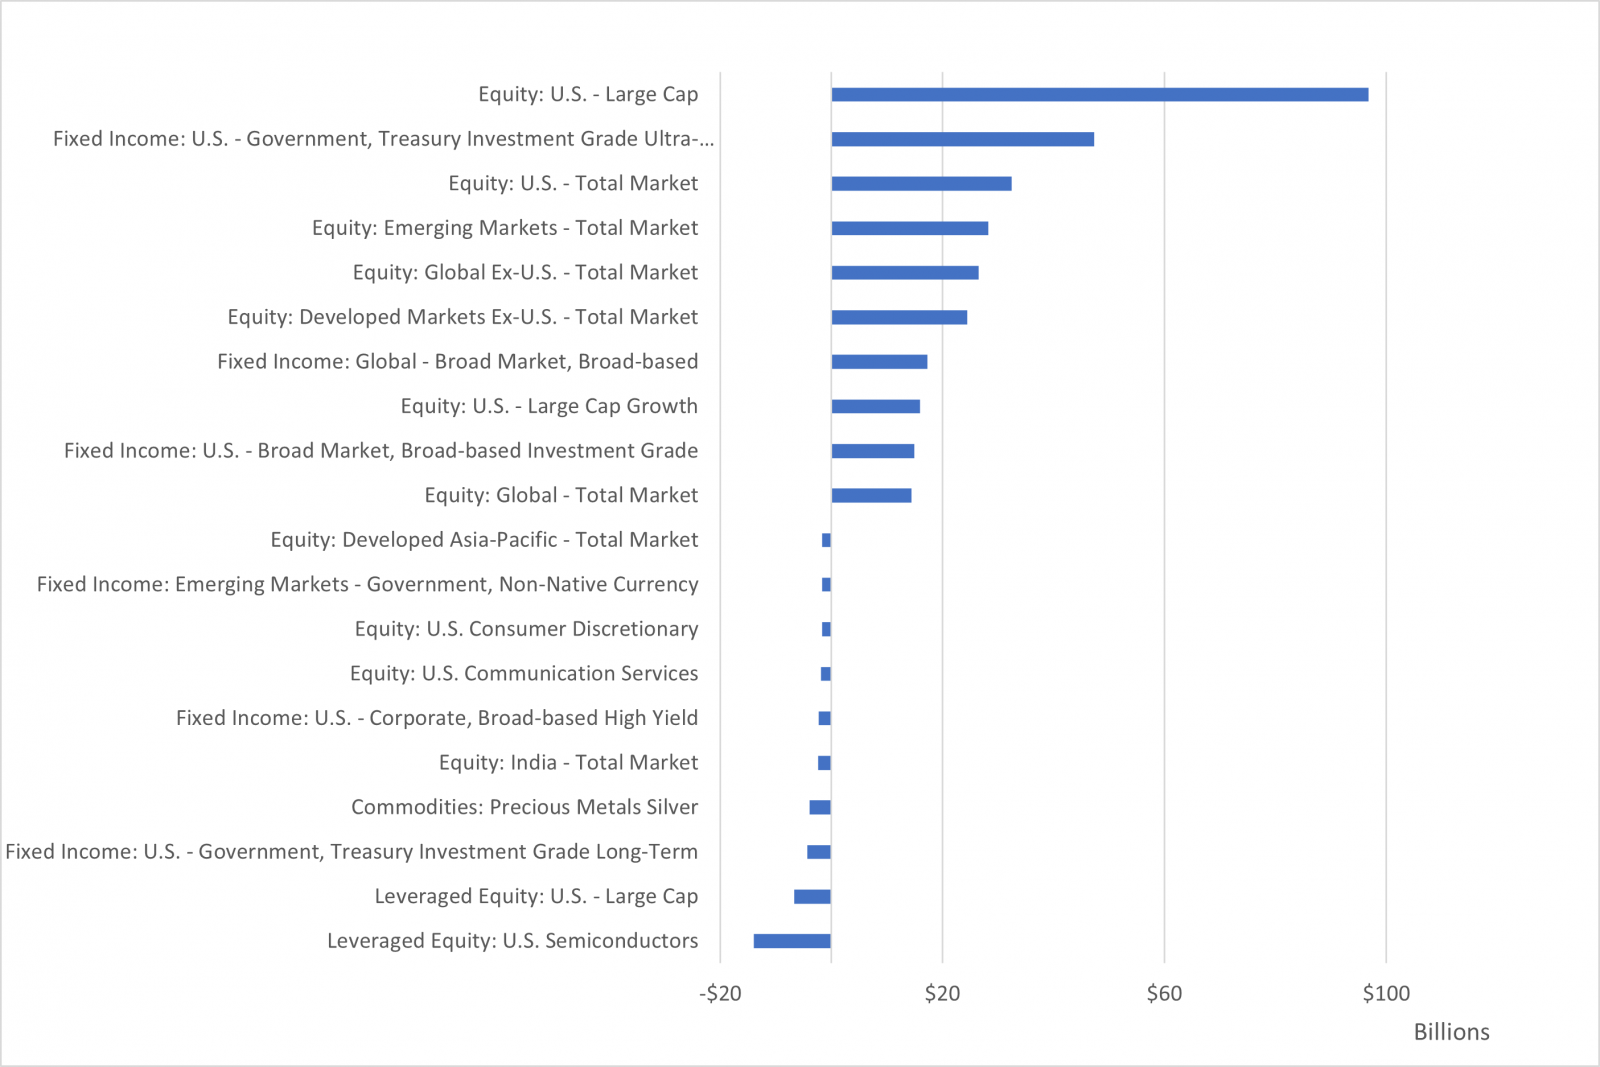
- Source: LPL Research, FactSet 04/30/26
- Disclosures: Past performance is no guarantee of future results.
Key Tactical Asset Allocation Takeaways
When comparing the latest LPL Research Strategic and Tactical Asset Allocation Committee (STAAC) views with the April flows data, there are a number of similarities. The STAAC continues to like the top asset class by assets and largest by YTD flows, U.S. large caps. The STAAC maintains a slight overweight to large/mid cap equities, with a tilt towards large/mid growth, which continues to benefit from sentiment surrounding AI and strong technology-driven earnings growth. Regionally, the STAAC has been warming up to the fourth-highest segment by flows YTD, emerging market equities, on improving fundamentals and technicals, but remains neutral from a geographic perspective within foreign equities, with a slight bias towards the U.S.
Within fixed income, the STAAC prefers core bond sectors over spread sectors as historically tight spreads make the relative risk-return profile of spread sectors less attractive. Outside of traditional stocks and bonds, the STAAC maintains an allocation to alternative investments, specifically in global macro and multi-strategy funds.
- Important Disclosures
- This material is for general information only and is not intended to provide specific advice or recommendations for any individual. There is no assurance that the views or strategies discussed are suitable for all investors. To determine which investment(s) may be appropriate for you, please consult your financial professional prior to investing.
- Investing involves risks including possible loss of principal. No investment strategy or risk management technique can guarantee return or eliminate risk.
- Indexes are unmanaged and cannot be invested into directly. Index performance is not indicative of the performance of any investment and does not reflect fees, expenses, or sales charges. All performance referenced is historical and is no guarantee of future results.
- This material was prepared by LPL Financial, LLC. All information is believed to be from reliable sources; however LPL Financial makes no representation as to its completeness or accuracy.
- Unless otherwise stated LPL Financial and the third party persons and firms mentioned are not affiliates of each other and make no representation with respect to each other. Any company names noted herein are for educational purposes only and not an indication of trading intent or a solicitation of their products or services.
- Asset Class Disclosures –
- International investing involves special risks such as currency fluctuation and political instability and may not be suitable for all investors. These risks are often heightened for investments in emerging markets.
- Bonds are subject to market and interest rate risk if sold prior to maturity.
- Municipal bonds are subject and market and interest rate risk and potentially capital gains tax if sold prior to maturity. Interest income may be subject to the alternative minimum tax. Municipal bonds are federally tax-free but other state and local taxes may apply.
- Preferred stock dividends are paid at the discretion of the issuing company. Preferred stocks are subject to interest rate and credit risk. They may be subject to a call features.
- Alternative investments may not be suitable for all investors and involve special risks such as leveraging the investment, potential adverse market forces, regulatory changes and potentially illiquidity. The strategies employed in the management of alternative investments may accelerate the velocity of potential losses.
- Mortgage backed securities are subject to credit, default, prepayment, extension, market and interest rate risk.
- High yield/junk bonds (grade BB or below) are below investment grade securities, and are subject to higher interest rate, credit, and liquidity risks than those graded BBB and above. They generally should be part of a diversified portfolio for sophisticated investors.
- Precious metal investing involves greater fluctuation and potential for losses.
- The fast price swings of commodities will result in significant volatility in an investor's holdings.
- This research material has been prepared by LPL Financial LLC.
- Not Insured by FDIC/NCUA or Any Other Government Agency | Not Bank/Credit Union Deposits or Obligations | Not Bank/Credit Union Guaranteed | May Lose Value
- For Public Use – Tracking: #1104203