4.7.26 March Flows: Risk-Off Rotation Reshapes Portfolios
With March and the first quarter (Q1) behind us, we conducted a deep dive into exchange-traded fund (ETF) flows over the month and year-to-date (YTD) periods. Flows measure the net movement of cash into and out of investment vehicles, such as mutual funds and ETFs. We analyzed flows to gain insight on investor demand and sentiment surrounding asset classes, sectors, and other segments of markets.
Broad Asset Class Flows
Global markets broadly sold off in March as mixed messaging around the escalating Iran war, coupled with the absence of a clear diplomatic off‑ramp and surging energy prices, reinforced risk‑off sentiment and stoked stagflation fears. The ETF market shrunk by a trillion dollars ($13.3 trillion vs. $14.3 trillion at the end of February), with equity ETFs seeing their asset base shrink the most. Despite the drawdown in performance, investors continued to pour into equity ETFs, which now represent 77% (~$10.3 trillion) of the total ETF market, experiencing a net flow of $63.6 billion, putting the YTD flows at $279 billion. Following the February rotation out of artificial intelligence (AI) stocks — which weighed on cyclical sectors such as information technology, communication services, and consumer discretionary — bearish sentiment spread to most other market sectors and foreign equities, with energy the notable exception as higher oil prices drove gains. Nonetheless, stocks continue to see strong flows, albeit across different asset classes than in the prior month.
Following a strong 2025 in which the Bloomberg U.S. Aggregate Bond Index (AGG) rose 7.3%, fixed income saw meaningful flows in March at $47 billion, bringing the YTD total to $169 billion. Fixed income ETFs represent more than 18% ($2.4 trillion) of the total ETF market, or roughly a quarter the size of the equity ETF market — combined they represent 95% of ETF assets. Although they are overshadowed by the equity market, they continue to punch above their weight by gathering more assets on a relative size basis. Despite the Federal Reserve’s (Fed) decision to lower interest rates three times in 2025, bonds continue to have an attractive yield relative to history, and we believe core bonds (Treasuries, investment-grade corporate bonds, and mortgage-backed securities (MBS)) in particular represent an equally attractive risk-reward trade-off as equities. Investors looking to escape equity market volatility have been rewarded by moving into the generally steadier, less volatile asset class.
Across diversifying strategies, including commodities, alternative investments, currencies, and allocation ETFs, commodities saw a notable outflow in March, as precious metals, primarily gold and silver, sold off meaningfully. Gold is typically seen as a safe haven asset in times of geopolitical conflict; however, given the potential for higher inflation and interest rate hikes (though not our base case), bond yields spiked, leading investors to chase yield in another perceived safe haven asset. Treasuries — backed by the full faith and credit of the U.S. government and offering a steady income stream — appeared to many investors to present a more attractive risk-reward tradeoff than gold. In March, commodities realized an $11.2 billion outflow, with gold experiencing a larger withdrawal than the broad category, losing $12.9 billion. The other diversifying strategies (alternatives, currency, and asset allocation) all saw positive flows over the month, with alternatives gathering nearly $3 billion; currency strategies gaining nearly $2 billion; and asset allocation strategies a little over $1 billion.
Flight to Safety: Fixed Income Narrows the Gap with Equities
Trailing one-month, YTD, and one-year net asset flows across broad asset classes (AUM, Billions $)
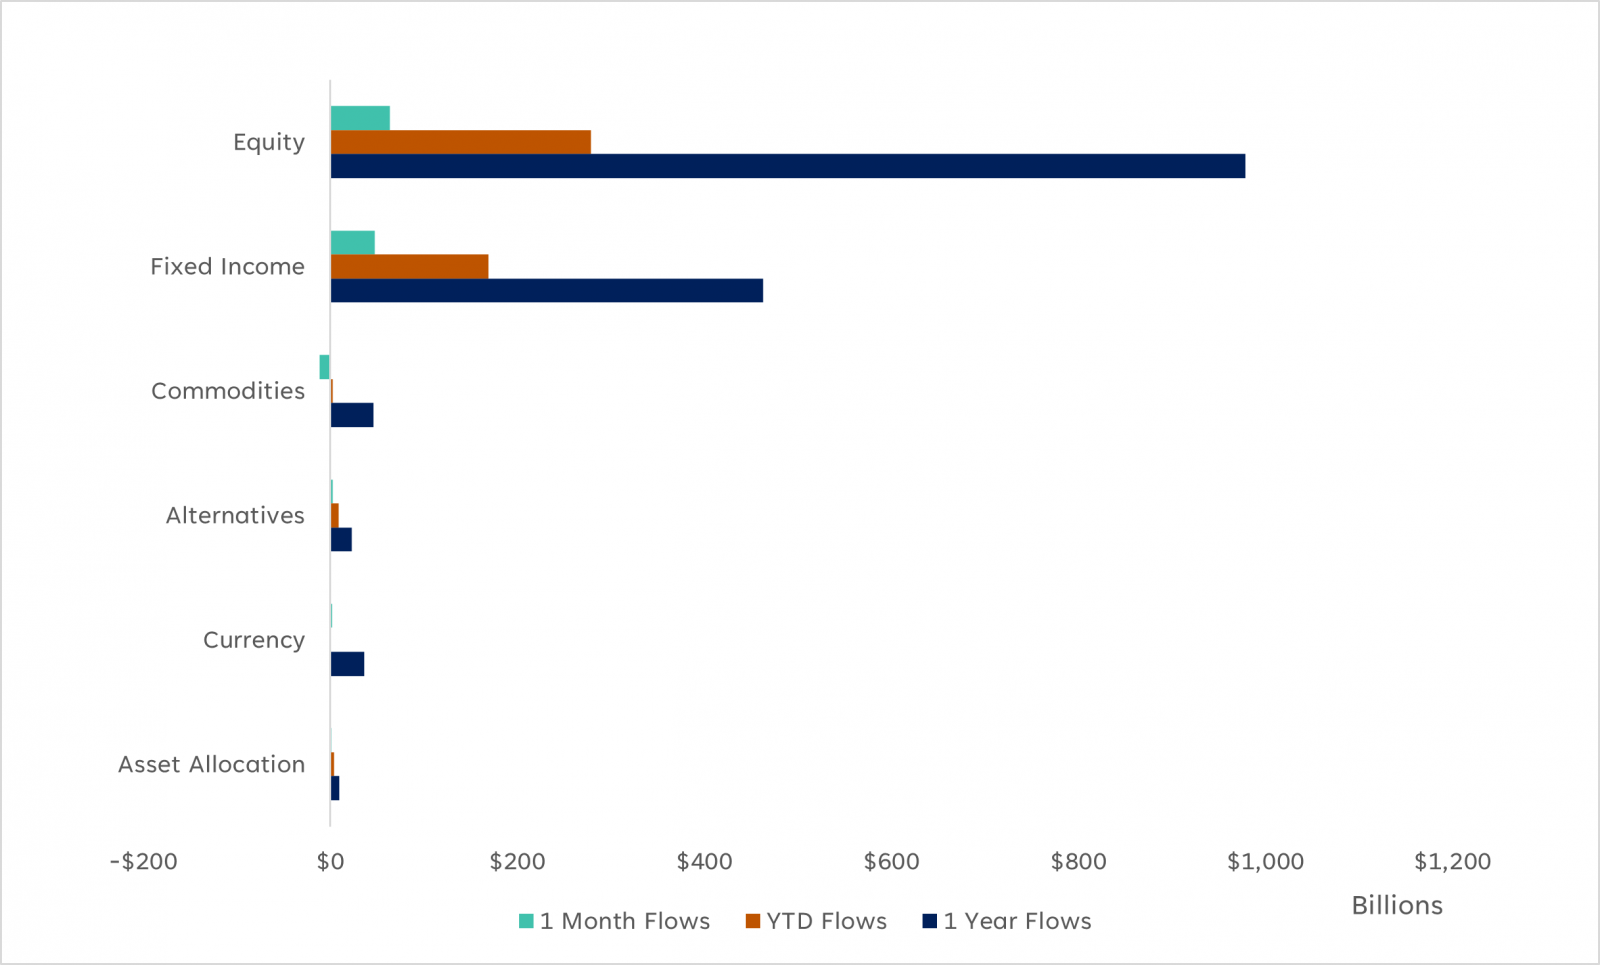
- Source: LPL Research, FactSet 03/31/26
- Disclosure: Indexes are unmanaged and cannot be invested in directly. Past performance is no guarantee of future results.
Asset Class Specific Flows
Equities
Within equities, developed markets ex-U.S. was the largest equity segment by flows over the month, gathering over $7.2 billion in assets. While a smaller segment of the equity ETF market (3% of the 77%), investors continue to diversify outside of domestic stocks, with developed market equities appearing relatively insulated from the Iran war and offering stocks at a cheaper valuation. U.S. large cap equities — the largest ETF segment overall at $3.4 trillion — experienced some of the largest outflows in March, losing $2.2 billion in assets. While investors fled U.S. equities, domestic stocks remain one of the top categories in YTD flows, gathering $25.8 billion, making it the second-largest equity segment by flows after emerging market (EM) equities ($26.2 billion). EM equities also suffered outflows in March, as countries heavily dependent on oil that passes through the Strait of Hormuz — namely the two largest components of the MSCI EM Index, China and India — saw capital leave over the period. India had a particularly rough March, ranking as the seventh largest segment by outflows ($1.9 billion) representing nearly a tenth of the total AUM in the segment. Despite a weak March, EM remains the top segment of equity ETFs in 2026, continuing their impressive 2025 performance, where the MSCI EM index rose more than 30%.
What’s notable about equities is the amount of capital flowing into non-U.S. equities. As previously mentioned, developed market ex-U.S. equities received the largest influx of capital over the month, but what’s also significant is the money that’s moved into the global ex-U.S. total market, developed market ex-North America total market growth, and global large cap segments, ranking fourth, sixth, and tenth, respectively, over the trailing one-month period. Despite a strong year for domestic stocks in 2025, with the S&P 500 up nearly 18%, investors continue to search for diversified return streams outside of the U.S., given domestic policy concerns, potential inflation, lower valuations, and heavy exposure to AI.
At the other end of the spectrum are sector and industry specific ETFs, such as information technology and, within information technology, the semiconductor industry. Semiconductor ETFs experienced outflows in March as a combination of valuation concerns, positioning unwinding, and broader risk‑off dynamics prompted investors to lock in gains after a strong run. The information technology segment ranked as the third largest segment by outflows in March ($3.4 billion), flipping their flows from positive to negative in the YTD period ($2.6 billion). Information technology is the largest equity segment by outflows in 2026 thus far.
Fixed Income
In fixed income, the ultra-short Treasury segment realized the largest influx of capital in March at $22.9 billion, besting the next closest segment, developed markets ex-U.S. equities, by nearly $16 billion. Ultra-short Treasuries also rose to the highest rank in the YTD period, as the significant inflows in March catapulted this safe haven asset to the top spot. The meaningful amount of assets that poured into this segment highlights the bearish sentiment of investors, as ultra-short Treasury bonds are considered one of the safest asset classes in terms of historical risk-return within fixed income and also compared to traditional equities and other nontraditional diversifying strategies. Many investors chose to remain on the sidelines while awaiting greater clarity from the parties involved in the geopolitical conflict, rotating out of riskier asset classes such as equities and commodities in favor of safer, more defensive assets, like ultra-short bonds. In addition to ultra-short bonds, two other bond segments appeared in the top 10 segments by flows, namely investment grade bonds ($5.2 billion) and global broad market bonds ($4.2 billion), as investors chose to invest up in the quality spectrum and diversify regionally.
Riskier sectors within fixed income markets, such as high-yield bonds and emerging market debt – non-native (or “hard”) currency, did not fare as well. These spread sectors tend to sell off in drawdowns as credit risk is generally higher in these categories relative to core sectors, like Treasuries and investment-grade corporate bonds. High-yield bonds lost $5 billion, while emerging market debt lost $1.8 billion. High-yield bonds are the top segment by outflows over the YTD period, as historically tight spreads and the relative risk-reward trade-off with core bonds hasn’t been worth the investment.
Diversifying Strategies
Across diversifying strategies, as noted earlier, gold is the clear loser, ranking first in terms of outflows in March ($13 billion), as investors ditched the yellow metal in favor of short-term Treasuries. Although gold is a much smaller segment of the broader ETF market (2.0%), it has consistently ranked in the top 10 segments by monthly flows as investors looked to diversify from traditional stocks and bonds. Silver ETFs also saw significant outflows, ranking fifth in terms of outflows over the month ($2.3 billion). Within commodities, broad market commodity ETFs, and those ETFs focused specifically on crude oil, saw significant flows as the price per barrel of oil rose sharply, crossing the psychological $100 / barrel threshold — a level not seen since 2022.
While small in size (0.9%), alternatives broadly have seen positive flows, with downside risk mitigation ETFs, also referred to as “buffer” ETFs, becoming more popular among investors as they try to protect their portfolios from drawdown risk with heightened volatility. Additionally, traditional hedge fund strategies, such as global macro, event driven, and managed futures, which are now being offered in ETF vehicles (although with stringent restrictions to stay within regulatory compliance), continue to gain assets. Collectively, these alternative strategies can be seen as defensive positions that offer uncorrelated return streams to traditional equities and fixed income.
Foreign Equities, Core Fixed Income Dominate YTD Flows
Trailing YTD net asset flows across FactSet segments (AUM, $ Billions)
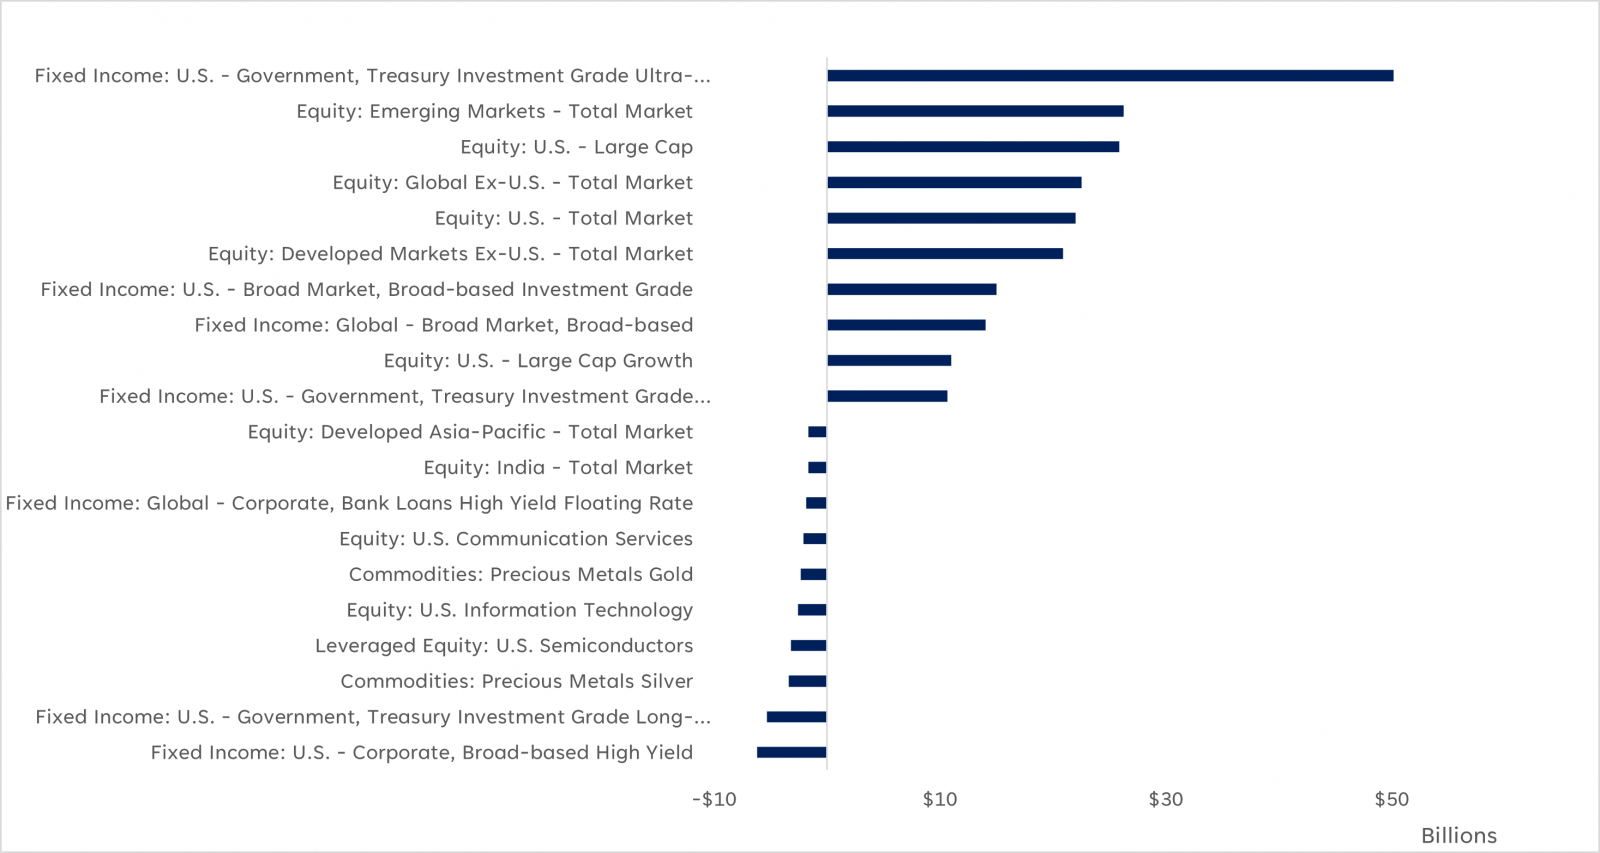
- Source: LPL Research, FactSet 03/31/26
- Disclosures: Past performance is no guarantee of future results.
Key Tactical Asset Allocation Takeaways
When comparing the latest LPL Research Strategic and Tactical Asset Allocation Committee (STAAC) views with the March flows data, there are a number of similarities. The STAAC continues to like the top asset class by assets and third largest by YTD flows, U.S. large caps. The STAAC maintains an overweight to large/mid cap equities over small, with a tilt towards large/mid growth over small value. Large/mid growth equities continue to benefit from strong technology-driven earnings, helping justify lofty valuations; however, recent underperformance and negative technicals have led to a slightly more negative bias on the asset class. Regionally, the STAAC has been warming up to the second-highest segment by flows YTD, emerging market equities, on improving fundamentals and technicals, but remains neutral from a geographic perspective between U.S., developed international, and emerging markets.
Within fixed income, the STAAC prefers core bond sectors over spread sectors as historically tight spreads make the relative risk-return profile of spread sectors less attractive. Outside of traditional stocks and bonds, the STAAC maintains an allocation to alternative investments, specifically in global macro, and multi-strategy funds.
- Important Disclosures
- This material is for general information only and is not intended to provide specific advice or recommendations for any individual. There is no assurance that the views or strategies discussed are suitable for all investors. To determine which investment(s) may be appropriate for you, please consult your financial professional prior to investing.
- Investing involves risks including possible loss of principal. No investment strategy or risk management technique can guarantee return or eliminate risk.
- Indexes are unmanaged and cannot be invested into directly. Index performance is not indicative of the performance of any investment and does not reflect fees, expenses, or sales charges. All performance referenced is historical and is no guarantee of future results.
- This material was prepared by LPL Financial, LLC. All information is believed to be from reliable sources; however LPL Financial makes no representation as to its completeness or accuracy.
- Unless otherwise stated LPL Financial and the third party persons and firms mentioned are not affiliates of each other and make no representation with respect to each other. Any company names noted herein are for educational purposes only and not an indication of trading intent or a solicitation of their products or services.
- Asset Class Disclosures –
- International investing involves special risks such as currency fluctuation and political instability and may not be suitable for all investors. These risks are often heightened for investments in emerging markets.
- Bonds are subject to market and interest rate risk if sold prior to maturity.
- Municipal bonds are subject and market and interest rate risk and potentially capital gains tax if sold prior to maturity. Interest income may be subject to the alternative minimum tax. Municipal bonds are federally tax-free but other state and local taxes may apply.
- Preferred stock dividends are paid at the discretion of the issuing company. Preferred stocks are subject to interest rate and credit risk. They may be subject to a call features.
- Alternative investments may not be suitable for all investors and involve special risks such as leveraging the investment, potential adverse market forces, regulatory changes and potentially illiquidity. The strategies employed in the management of alternative investments may accelerate the velocity of potential losses.
- Mortgage backed securities are subject to credit, default, prepayment, extension, market and interest rate risk.
- High yield/junk bonds (grade BB or below) are below investment grade securities, and are subject to higher interest rate, credit, and liquidity risks than those graded BBB and above. They generally should be part of a diversified portfolio for sophisticated investors.
- Precious metal investing involves greater fluctuation and potential for losses.
- The fast price swings of commodities will result in significant volatility in an investor's holdings.
- This research material has been prepared by LPL Financial LLC.
- Not Insured by FDIC/NCUA or Any Other Government Agency | Not Bank/Credit Union Deposits or Obligations | Not Bank/Credit Union Guaranteed | May Lose Value
- For Public Use – Tracking: #1088863
Contact us directly should you have questions about this topic.