4.29.26 Two Equity Trends That Highlight Diversification
With big tech earnings season kicking off in earnest this week, investors will split their attention between analyzing the latest signals on artificial intelligence (AI) spending plans and the seemingly never-ending peace negotiations with Iran (along with the still closed Strait of Hormuz). While LPL Research will be doing the same attention splitting exercise, we also wanted to take a step back and review two somewhat longer-term performance trends that we find instructive. First, we review the oft-debated asset allocation decision of U.S. versus international equities (and further between developed international equities and emerging market equities). Second, we review two U.S. equity sectors, information technology (I.T.) and energy, that have had the strongest total return performance over the trailing five years, and are two of the three sectors that individually outperformed the broad S&P 500 index (the third being communication services), despite exhibiting fairly low correlation to one another. Each of these look-backs are solely that, historical reviews of performance data, and this blog is not making a call on either trend continuing or reversing. Rather, we point out these trends because (1) we find them interesting given the seemingly myopic focus on U.S. tech stocks, and (2) they remind investors of the importance of diversification within equity allocations.
Last summer, as tariff fears eased and U.S. stocks attempted to re-assert leadership versus international developed market stocks (DM ex U.S.), we wrote about the factors that had driven U.S. stock outperformance over the prior 15 years (2010-2024), which were primarily expanding relative valuation spreads and superior top-line growth. We also highlighted that if international equities outperformed for the rest of 2025, it would be just the fourth calendar year since 2010 to do so. International stocks, from both developed and emerging markets, did in fact outperform U.S. stocks in 2025 and continue to outperform in 2026 year-to-date. The current year's outperformance for developed market international stocks is small at less than 1%, but emerging markets have outperformed by over 11%. Taken together, international equities (measured by the MSCI All-Country World excluding U.S. Index) are outperforming domestic equities (measured by the S&P 500) so far this year by about 3.5%, excluding dividends. If we look back to the eve of the 2024 election to date, international stocks have outperformed U.S. stocks by ~9%. We home in on the 2024 election given the Trump administration’s “America First” policy posture and the market’s initial reaction to the election, where U.S. stocks outperformed through roughly the end of February 2025. However, as markets began to digest the potential impacts of the administration’s trade policies (i.e., tariffs), the dollar weakened, and the narrative shifted, and international stocks began to outperform. Despite the strong U.S. equity recovery from the “Liberation Day” lows in April through the third quarter, persistent dollar weakness and attractive relative valuations supported international equities through 2025 year-end. As noted, international outperformance has continued in 2026, driven by emerging market equities.
International Equities Have Outperformed U.S. Equities Since 2024 Election Day
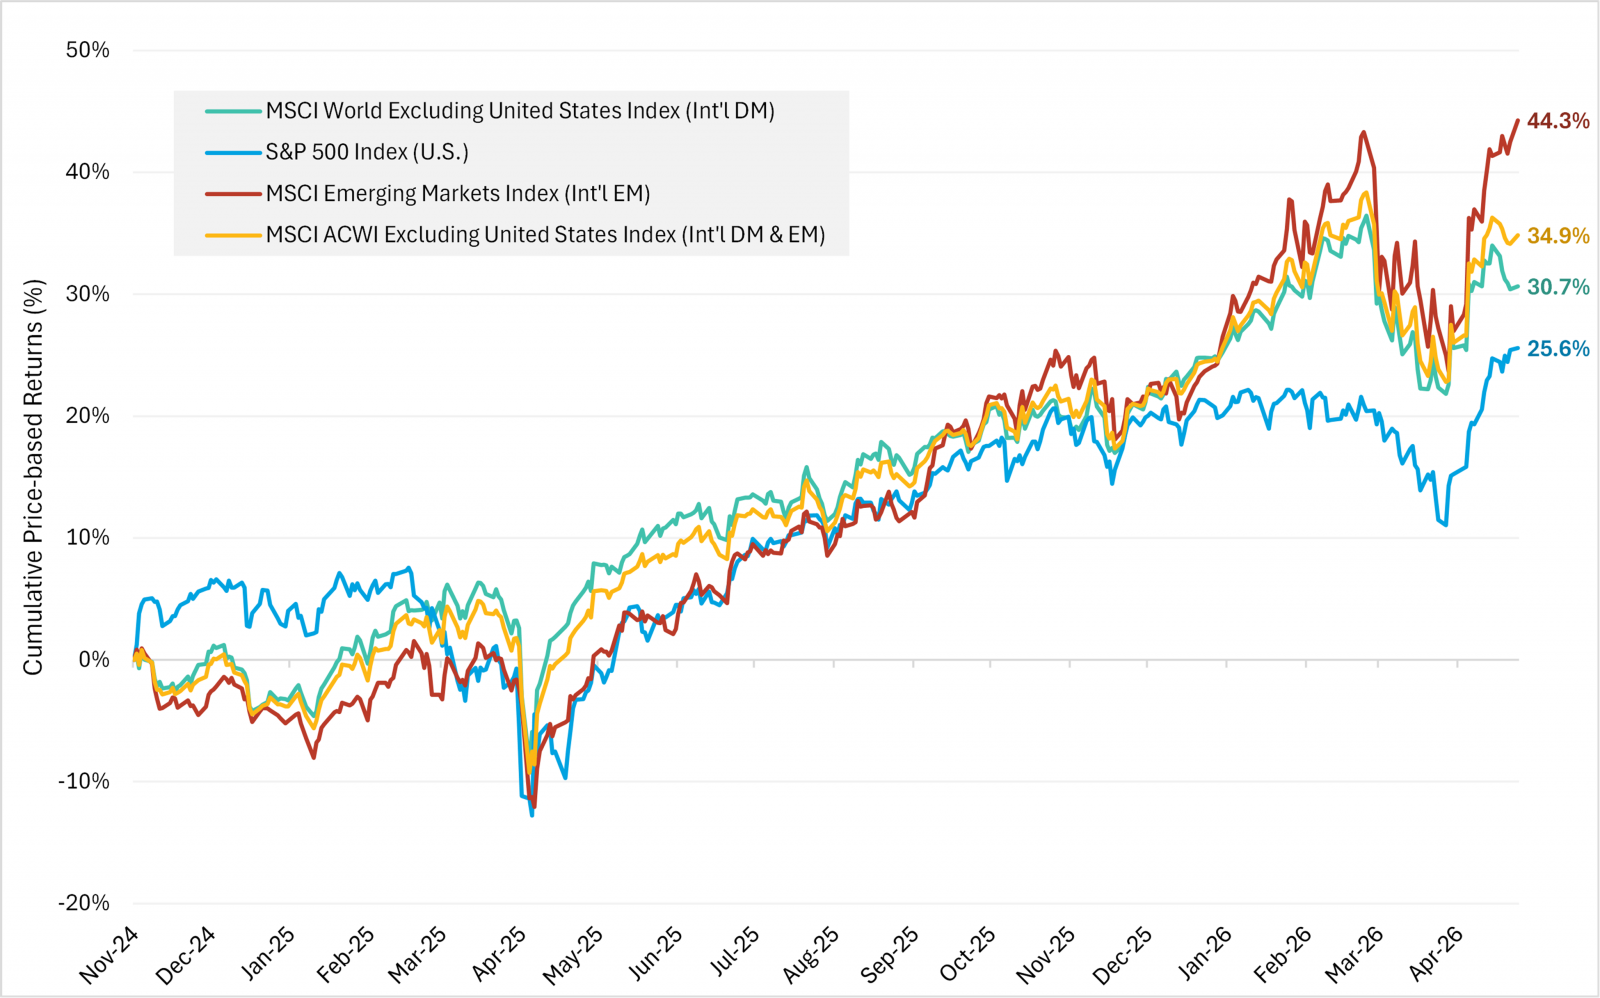
- Source: LPL Research, Bloomberg 04/28/26
- Disclosures: Past Performance is no guarantee of future results. Indexes are unmanaged and cannot be invested in directly.
Shifting to domestic equity sectors, the trailing five-year performance of the 11 S&P 500 GICS sector indexes reveals a potentially unexpected sector among the leadership: energy. The S&P 500 Energy sector index, dominated by large integrated oil companies such as Exxon Mobil Corp. (Ticker: XOM) and Chevron Corp. (Ticker: CVX), has generated annualized total returns over the trailing five-year period of 23.3% (~184% on a cumulative total return basis). This compares to 20.6% annualized (~155% cumulative) for the S&P 500 I.T. sector index, and 13.0% annualized (~84% cumulative) for the broad market S&P 500 index. Now, the starting point of course influences this look-back, and anyone can have fun with charts and starting points. In April 2021, the energy sector was still trading below its pre-pandemic levels, while the I.T. sector was making new all-time highs. Nonetheless, trailing five-year performance is a common look back period, and the performance is what it is. Note that the above figures are based on total performance, i.e., inclusive of re-invested dividends. Using price-based returns, the energy sector falls slightly behind technology in the trailing five-year lookback (still good for second rank among sectors), given the energy sector’s above average dividend yield over the period.
Energy and Information Technology Best Performing Sectors Over Last Five Years
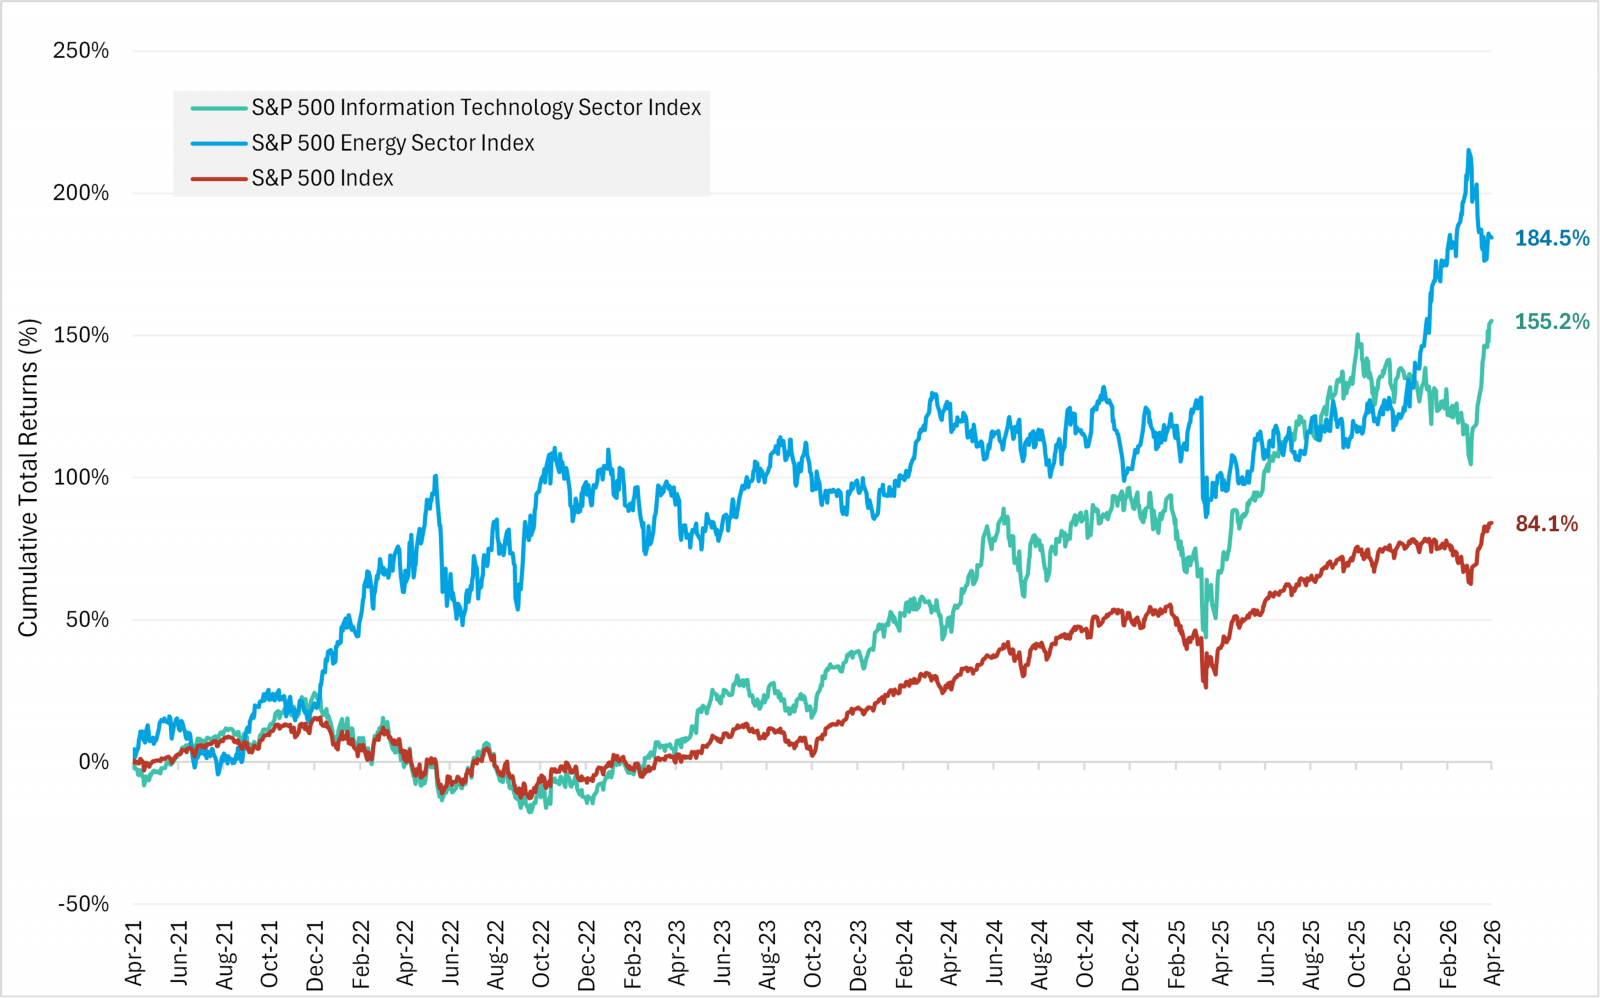
- Source: LPL Research, Bloomberg 04/28/26
- Disclosures: Past performance is no guarantee of future results. Indexes are unmanaged and cannot be invested in directly.
An interesting point on the sector performance data is that energy has tended to lead during periods of broader market weakness, serving as a useful diversifying asset. Elevated oil and gas prices weren’t always the driver of broader equity market weakness in these periods; in 2022, commodities broadly outperformed as inflation rose, though few would argue commodities drove the rise in inflation, at least initially. Some may point to the Iran war driving the recent outperformance of the energy sector and suggest that energy’s gain is the market’s loss. However, the energy sector was already outperforming before the war and has given back most of the performance it added after the war started. All that’s to say, over the last five years the energy sector has provided investors diversification benefits without sacrificing performance. In fact, during the trailing five-year period analyzed, the energy sector had the lowest correlation of weekly returns of all sectors relative to the broad market as well as to large individual sectors such as I.T., communication services, and consumer discretionary
While we found these trends insightful, we reiterate we are not making a call that any particular trend will either continue or reverse. Analyzing performance data such as these provide investors context for where markets have been, to better understand where they may go in the future and help make the case for diversification within equity portfolios, both by region and sector.
- Important Disclosures
- This material is for general information only and is not intended to provide specific advice or recommendations for any individual. There is no assurance that the views or strategies discussed are suitable for all investors. To determine which investment(s) may be appropriate for you, please consult your financial professional prior to investing.
- Investing involves risks including possible loss of principal. No investment strategy or risk management technique can guarantee return or eliminate risk.
- Indexes are unmanaged and cannot be invested into directly. Index performance is not indicative of the performance of any investment and does not reflect fees, expenses, or sales charges. All performance referenced is historical and is no guarantee of future results.
- This material was prepared by LPL Financial, LLC. All information is believed to be from reliable sources; however LPL Financial makes no representation as to its completeness or accuracy.
- Unless otherwise stated LPL Financial and the third party persons and firms mentioned are not affiliates of each other and make no representation with respect to each other. Any company names noted herein are for educational purposes only and not an indication of trading intent or a solicitation of their products or services.
- Asset Class Disclosures –
- International investing involves special risks such as currency fluctuation and political instability and may not be suitable for all investors. These risks are often heightened for investments in emerging markets.
- Bonds are subject to market and interest rate risk if sold prior to maturity.
- Municipal bonds are subject and market and interest rate risk and potentially capital gains tax if sold prior to maturity. Interest income may be subject to the alternative minimum tax. Municipal bonds are federally tax-free but other state and local taxes may apply.
- Preferred stock dividends are paid at the discretion of the issuing company. Preferred stocks are subject to interest rate and credit risk. They may be subject to a call features.
- Alternative investments may not be suitable for all investors and involve special risks such as leveraging the investment, potential adverse market forces, regulatory changes and potentially illiquidity. The strategies employed in the management of alternative investments may accelerate the velocity of potential losses.
- Mortgage backed securities are subject to credit, default, prepayment, extension, market and interest rate risk.
- High yield/junk bonds (grade BB or below) are below investment grade securities, and are subject to higher interest rate, credit, and liquidity risks than those graded BBB and above. They generally should be part of a diversified portfolio for sophisticated investors.
- Precious metal investing involves greater fluctuation and potential for losses.
- The fast price swings of commodities will result in significant volatility in an investor's holdings.
- This research material has been prepared by LPL Financial LLC.
- Not Insured by FDIC/NCUA or Any Other Government Agency | Not Bank/Credit Union Deposits or Obligations | Not Bank/Credit Union Guaranteed | May Lose Value
- For Public Use – Tracking: #109780