4.1.26 Where Has Active Management Shined and Struggled?
LPL Research periodically conducts a detailed study that examines when and where active management has performed well. Our data includes actively-managed mutual funds across a variety of asset categories, going back 20 years. We assess active management using a variety of criteria. Here we present what we believe are two essential and complementary criteria: excess returns and batting averages. For excess returns, we take the return of each fund and subtract the returns for the benchmark we designate for that asset class. Pardon the baseball reference, but batting average simply means the percentage of funds that outperformed the benchmark designated for the asset class.
While we are eager to present our results, let us first point out some careful details we undertake.
• To have fair comparisons, funds were measured against appropriate benchmarks. For example, small value funds were measured against the Russell 2000 Value Index.
• We break the 20-year period into smaller three-year chunks, overlapping “rolling-periods,” to help us measure consistency and how performance has changed over time.
• Where possible, we included the returns of funds that no longer exist. This helps adjust for survivorship bias, the idea that worse-performing funds may get liquidated or merged into other funds, artificially inflating the return of the “average fund.”
• Since we are interested in studying the effectiveness of active management, we excluded index funds.
• We focused on institutional share classes, the type of shares commonly used in advisory programs.
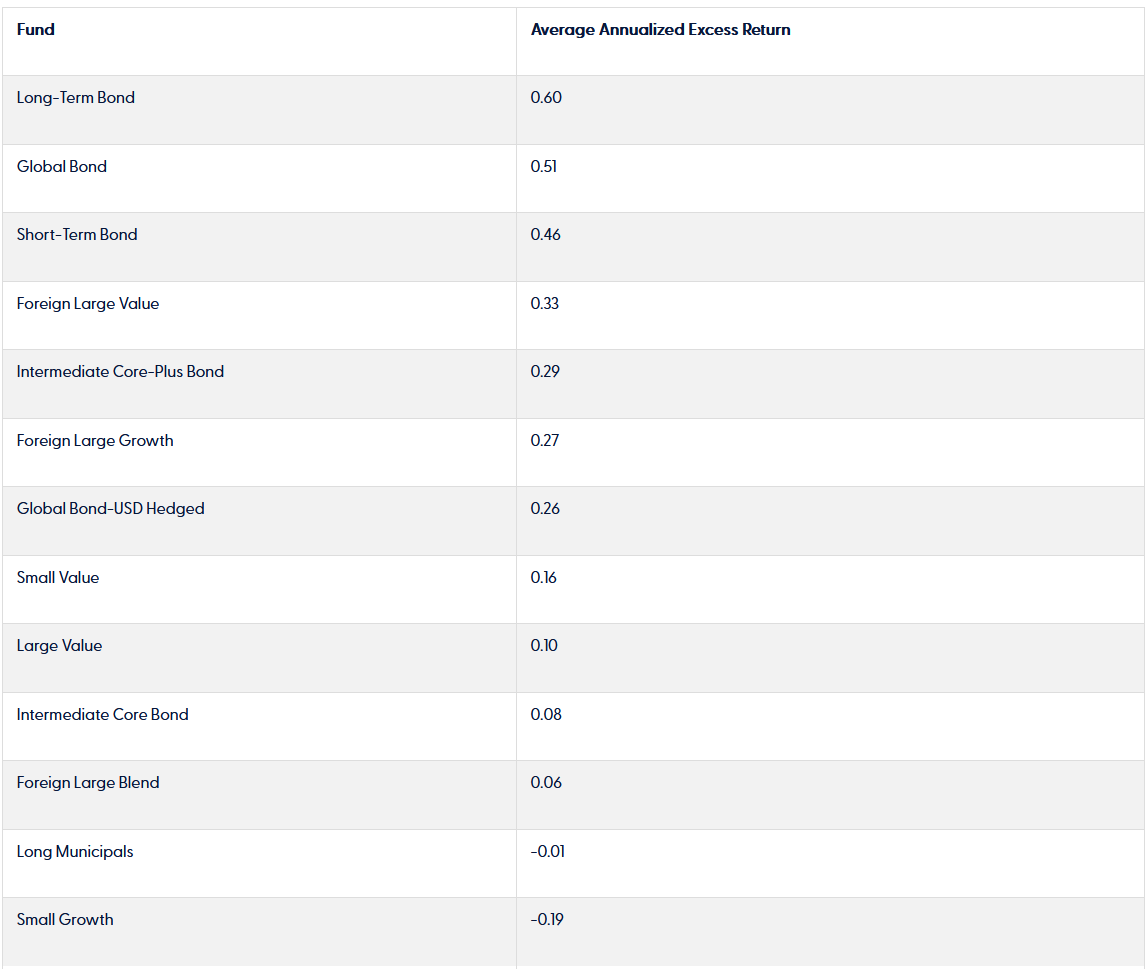
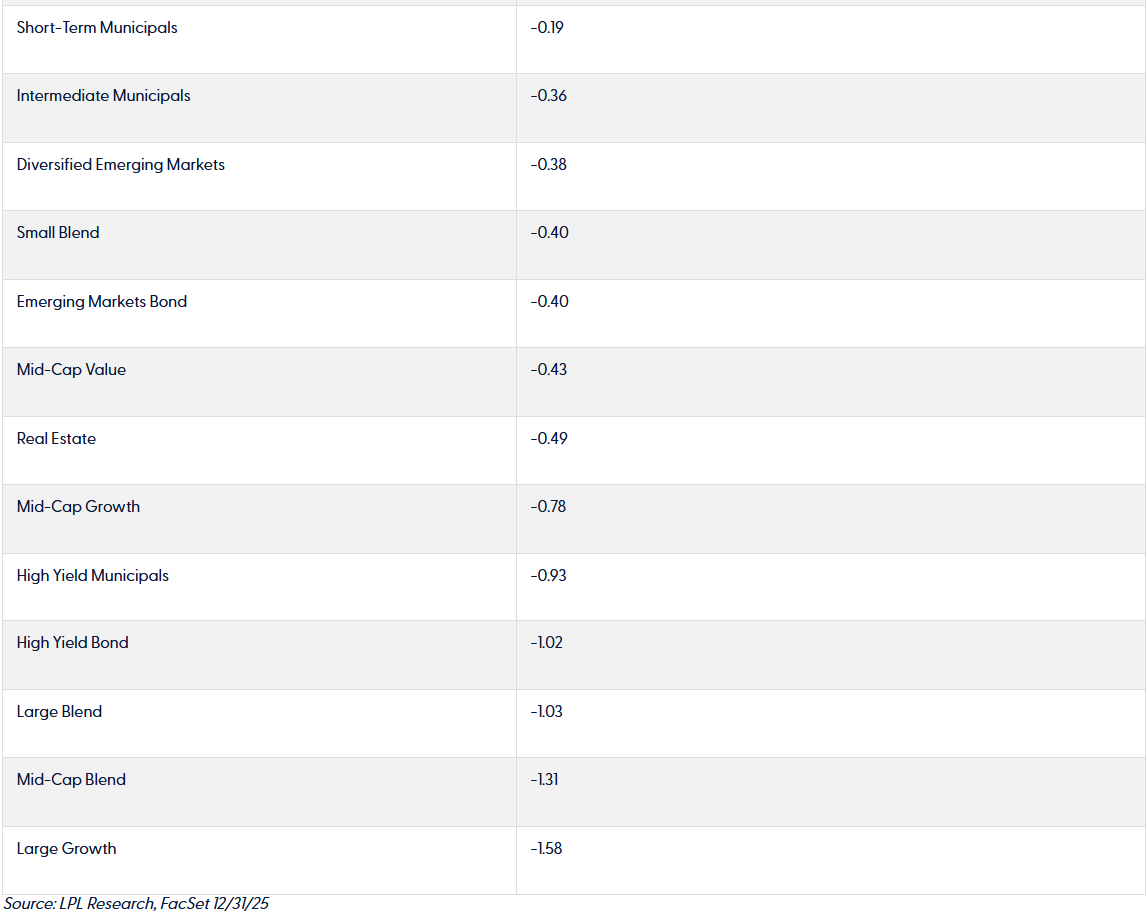
Without further ado, below, we rank each asset class from best to worst based on the funds’ excess returns compared to the designated benchmark. The three asset classes where active management was generally more successful included Long-term Bonds, Global Bonds, and Short-term Bonds. Meanwhile, Large Blend, Mid Blend, and Large Growth were asset classes where active management generally underperformed. The number of individual funds in each category range from 50 to 300.
Active Funds’ Excess Returns Versus Benchmarks
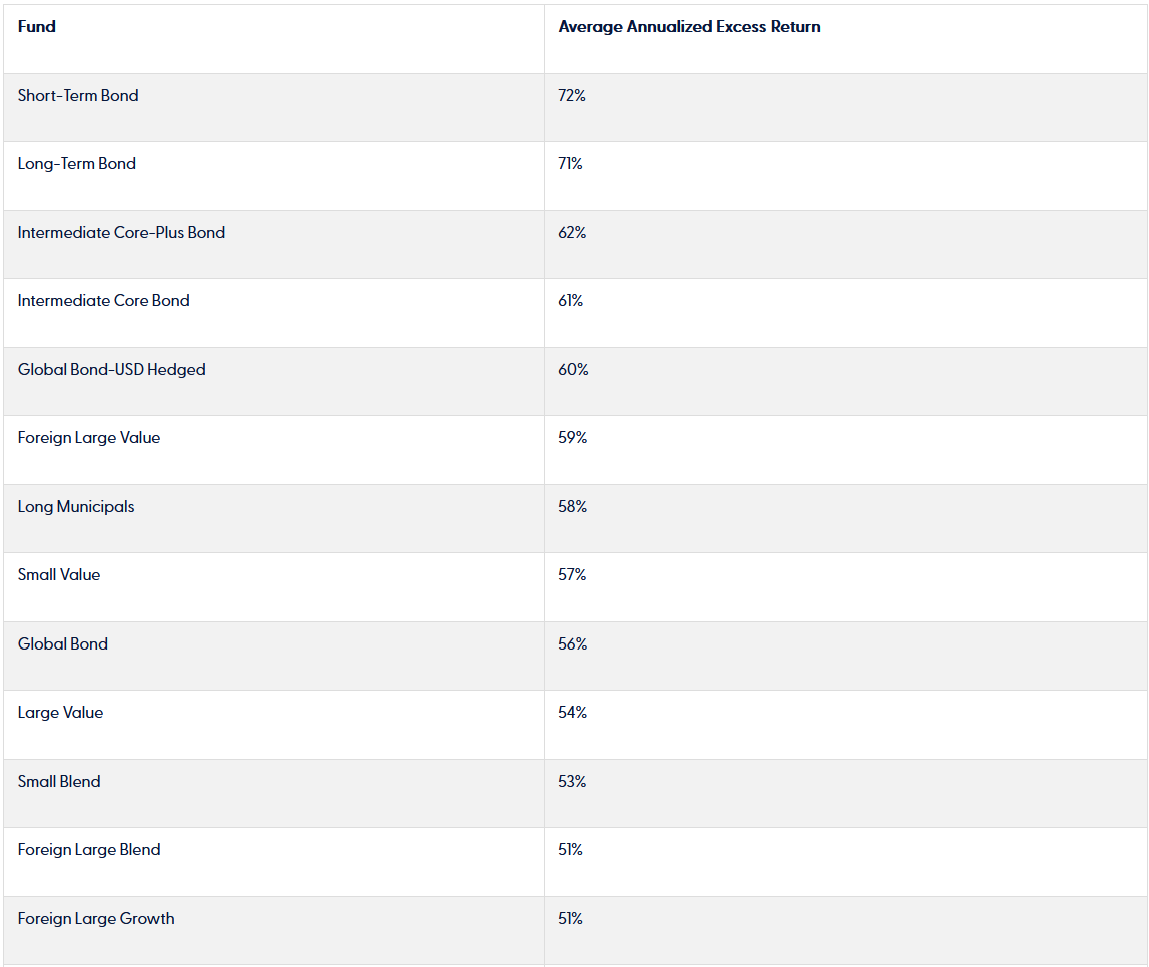
Next, we rank each asset class from best to worst based on batting averages – the percentage of funds in that asset class that outperformed – it is actually an average of 3-year rolling periods over the last 20 years. A relatively higher percentage of active managers outperformed benchmarks within Short-term Bonds, Long-term Bonds, and Intermediate Core-Plus Bonds. Meanwhile, High Yield Municipals, Large Growth, and High Yield Bonds were places where fewer active managers outperformed.
Percent of Active Funds that Outperformed Benchmarks (Average of 3-Year Periods)
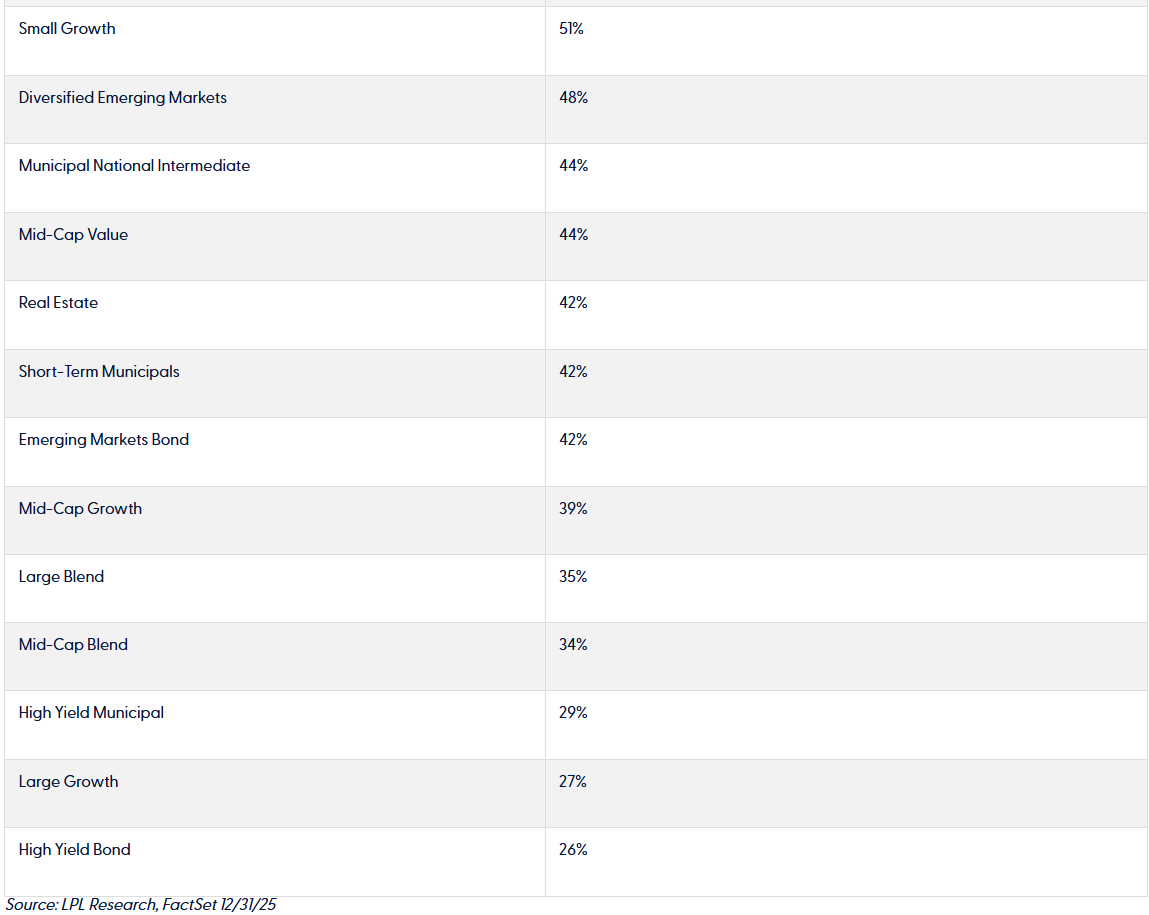
The results based on the two methods generally line up fairly closely. In cases where more than 50% of actively managed funds outperformed, the excess return of the average fund was generally positive as well. There were only three cases where batting averages were above 50% but excess returns were negative, including Small Blend, Small Growth, and Long Municipals.
Recent Trends in Batting Averages
• 3-year batting averages for small- and mid-cap active managers declined for year-end 2025 as compared to year-end 2024. This coincided with a sharply advancing equity market in 2025, and one in which higher-risk stocks generally outperformed. Our research suggests that active managers tend to outperform their benchmarks more readily in down markets, while they often struggle in sharply advancing markets. Many small cap active managers position their portfolios with higher quality and lower risk than the benchmarks, which can prevent them from keeping pace during sharply advancing markets.
• Many fixed-income asset classes had improvements in their 3-year active manager batting averages in 2025 as compared to 2024, including Long Municipals, Intermediate Municipals, Intermediate Core-Plus Bonds, and Short-Term Bonds.
Broader Observations
• Taxable fixed income asset classes have historically been some of the best for active management relative performance. This may reflect the many varied decisions active managers are able to make, such as which sectors and maturities to emphasize, in addition to security selection.
• Active management has generally been more favorable in small caps as compared to large-and mid-caps. Within small caps, there are a greater number of companies available for active managers to scour for opportunities. Additionally, smaller companies may be less well covered and understood by market participants, creating more opportunities for active managers putting in the leg work.
• Within large-cap, small-cap, and foreign equities, active managers of value-style equities have generally outperformed their value benchmarks more readily than growth managers have outperformed their growth benchmarks. Domestically, this may be a reflection of the strong long-term index performance in the growth benchmarks that has been difficult for active managers to outpace.
How Does This Apply to Portfolios We Manage?
LPL Research manages a variety of Active-Passive portfolios that include both actively-managed and passively-managed investments. Our Active-Passive framework allows us to generally tilt toward active management in the asset classes where our research suggests it may have greater potential for outperformance. Excess returns and batting averages are two of the many quantitative factors we evaluate. We also consider softer, hard-to-quantify criteria that may impact the results of active managers. For example, we believe the below asset classes may be more favorable for active managers than historical data suggests.
• Diversified Emerging Markets. Active managers can make judgments about geopolitical risks in emerging markets, whereas passive funds must stick with benchmark weightings despite any negative impacts. Emerging market indices can also become concentrated in certain countries or sectors, making the performance of passive funds heavily dependent upon these exposures.
• High Yield Bonds. The high yield indices often tilt towards the largest issuers and most liquid securities, and passive funds must invest accordingly, regardless of increased risks or forgone opportunities. Additionally, passively-managed high yield funds, in certain time periods, have struggled to match the returns of the benchmark index.
• Long-term Municipals and High Yield Municipals. Passively-managed funds in these categories, in certain time periods, have struggled to match the returns of the benchmark index. We also believe that inefficiencies in the municipal market may be more plentiful in longer-maturity and lower-quality bonds, allowing active managers to potentially add yield to their portfolios while proactively monitoring risk.
- Important Disclosures
- This material is for general information only and is not intended to provide specific advice or recommendations for any individual. There is no assurance that the views or strategies discussed are suitable for all investors. To determine which investment(s) may be appropriate for you, please consult your financial professional prior to investing.
- Investing involves risks including possible loss of principal. No investment strategy or risk management technique can guarantee return or eliminate risk.
- Indexes are unmanaged and cannot be invested into directly. Index performance is not indicative of the performance of any investment and does not reflect fees, expenses, or sales charges. All performance referenced is historical and is no guarantee of future results.
- This material was prepared by LPL Financial, LLC. All information is believed to be from reliable sources; however LPL Financial makes no representation as to its completeness or accuracy.
- Unless otherwise stated LPL Financial and the third party persons and firms mentioned are not affiliates of each other and make no representation with respect to each other. Any company names noted herein are for educational purposes only and not an indication of trading intent or a solicitation of their products or services.
- Asset Class Disclosures –
- International investing involves special risks such as currency fluctuation and political instability and may not be suitable for all investors. These risks are often heightened for investments in emerging markets.
- Bonds are subject to market and interest rate risk if sold prior to maturity.
- Municipal bonds are subject and market and interest rate risk and potentially capital gains tax if sold prior to maturity. Interest income may be subject to the alternative minimum tax. Municipal bonds are federally tax-free but other state and local taxes may apply.
- Preferred stock dividends are paid at the discretion of the issuing company. Preferred stocks are subject to interest rate and credit risk. They may be subject to a call features.
- Alternative investments may not be suitable for all investors and involve special risks such as leveraging the investment, potential adverse market forces, regulatory changes and potentially illiquidity. The strategies employed in the management of alternative investments may accelerate the velocity of potential losses.
- Mortgage backed securities are subject to credit, default, prepayment, extension, market and interest rate risk.
- High yield/junk bonds (grade BB or below) are below investment grade securities, and are subject to higher interest rate, credit, and liquidity risks than those graded BBB and above. They generally should be part of a diversified portfolio for sophisticated investors.
- Precious metal investing involves greater fluctuation and potential for losses.
- The fast price swings of commodities will result in significant volatility in an investor's holdings.
- This research material has been prepared by LPL Financial LLC.
- Not Insured by FDIC/NCUA or Any Other Government Agency | Not Bank/Credit Union Deposits or Obligations | Not Bank/Credit Union Guaranteed | May Lose Value
- For Public Use – Tracking: #1087045
Contact us directly should you have questions about this topic.