11.19.24 October 2024 Fund Flows Recap
With October behind us, we conducted a deeper dive into fund flows over the month. Flows measure the net movement of cash into and out of investment vehicles, such as mutual funds and exchange-traded funds (ETF). We analyzed flows to gain insight into investor demand and sentiment surrounding asset classes, sectors, and other classifications of markets.
Morningstar Category Flows
When looking at Morningstar category data in October, large blend equities experienced the largest inflow at $21.1 billion. This continues a trend we’ve seen throughout the year, as the large blend category is the top category in terms of flows over the trailing year-to-date (YTD) period, gaining nearly $150 billion in inflows. Following large blend equities were intermediate core bonds, gathering $16.8 billion in flows. Like large blend equities, intermediate core bonds, and its more aggressive compliment category, intermediate core-plus bonds, have been a favorite category for investors this year, ranking second and third, respectively, over the YTD period, gathering a combined $164.4 billion. Another notable category was China’s equities, gaining $9.6 billion in flows in October. Chinese equities were one of the top-performing categories throughout mid-to-late September and into early October, gaining over 30% between September 10th and October 7th. Investors poured into Chinese equities following the announcement of a stimulus package, hoping to spur its lackluster economic growth in recent years.
Looking at the other end of the spectrum, large growth funds experienced the largest net outflows of $8.6 billion in October. Large growth stocks, as measured by the Russell 1000 Growth Index, have gained nearly 24% this year. The significant outflows in October could be a sign of investors taking profits in one of the top-performing categories YTD. Following large growth, were a combination of foreign equities (foreign large growth and diversified emerging markets) and large-cap value equities. Foreign equities, both developed and emerging, have trailed domestic equities all year, with October being another month of relative underperformance. Large value stocks continue to see outflows, ranking as the third largest category by outflows in October and fourth over the YTD period.
China Sees a Boost in Flows Following Stimulus Announcement
Trailing One-Month Net Asset Flows: Top Ten and Bottom Ten Across Morningstar Categories (AUM, Billions $)
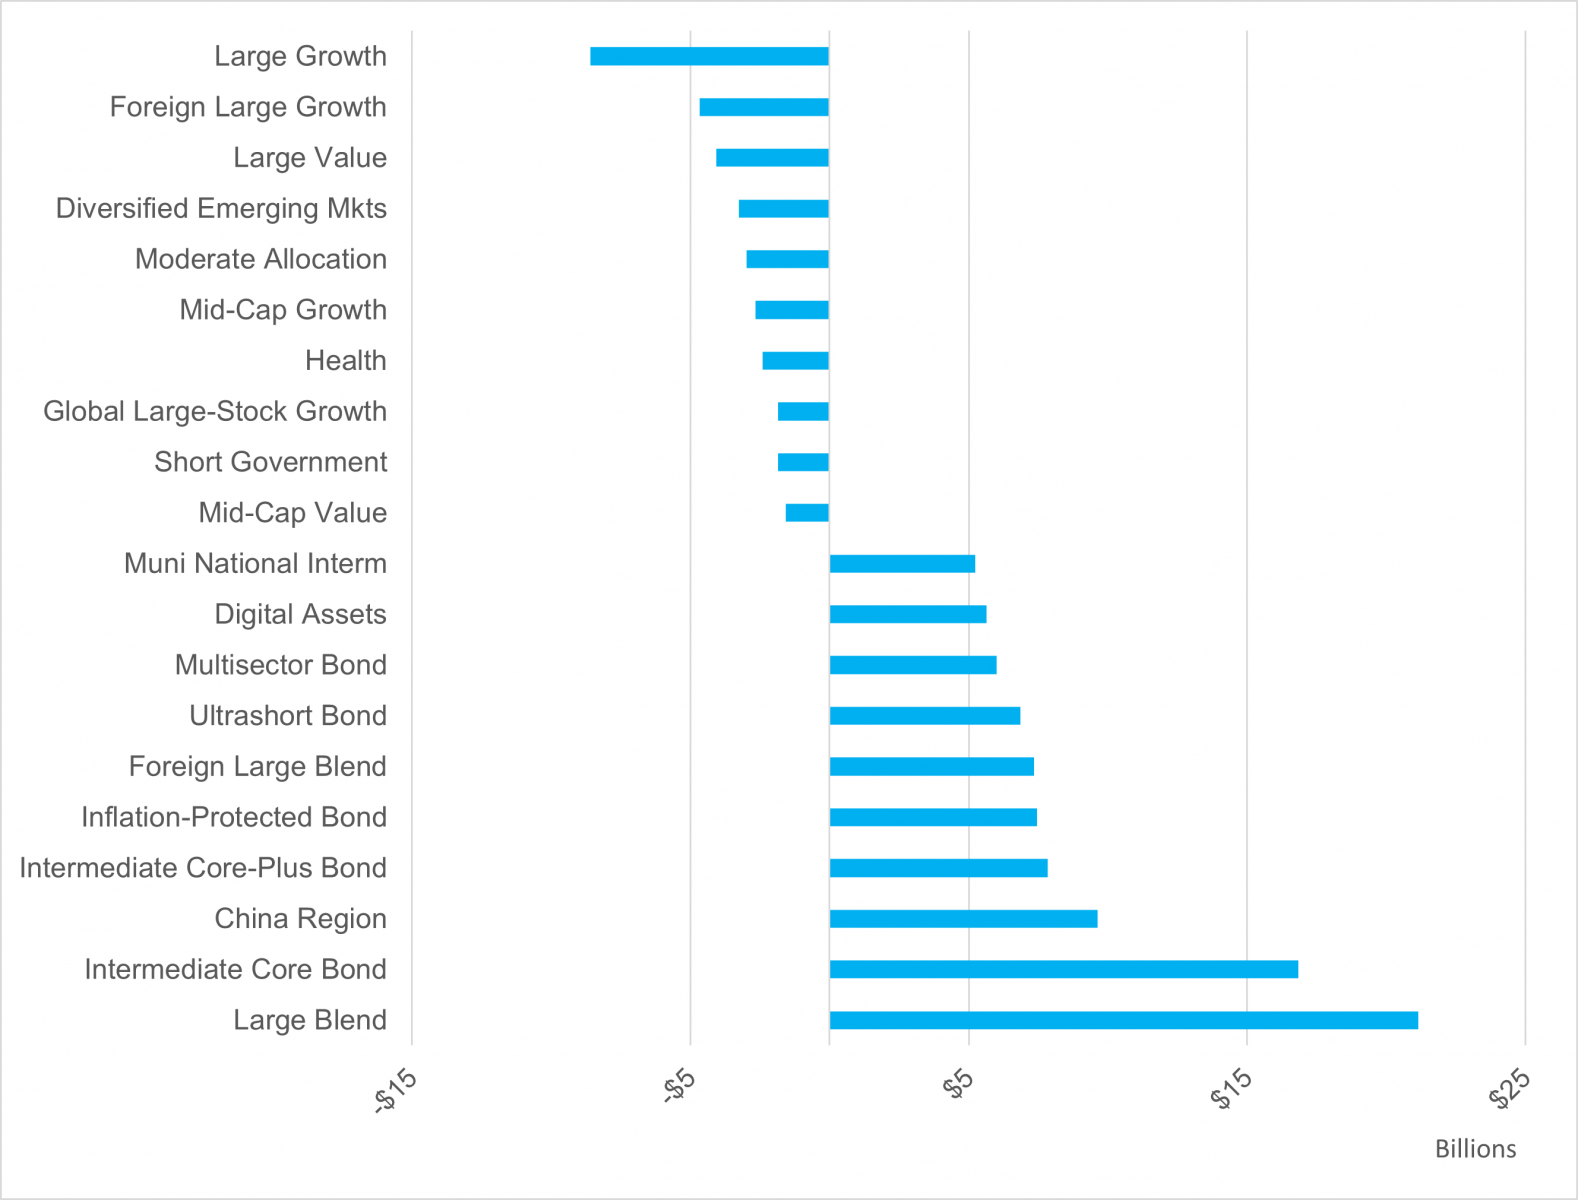
- Source: LPL Research, Morningstar Direct, 11/19/24
Disclosures: Indexes are unmanaged and cannot be invested in directly. Past performance is no guarantee of future results.
Sector Flows
When looking at individual equity sector data in October, the industrials and real estate sectors reported the largest inflows at roughly $1.5 billion each. Both sectors have seen meaningful inflows this year, with real estate and industrials ranking second and third, respectively. While real estate and industrials have gathered significant assets YTD, they still trail technology by a significant margin. Technology remains as the top sector YTD, with $18.1 billion in inflows, nearly six times the next closest sector (real estate) at $3.7 billion. Real estate also continues a trend from the prior month where the sector outperformed its sector peers by inflows following impressive performance in the third quarter (Q3), gaining roughly 17%.
Conversely, health care experienced the largest outflow in October at $2.4 billion. Health care has struggled in 2024, having been one of the top three sectors in terms of outflows in eight out of the last 10 months. Given the trend we’ve seen of investors chasing performance (with capital pouring into the top sector YTD, technology), it’s no surprise investors are dumping health care, following a lackluster October (dropping 4.6%) and an underwhelming YTD performance (up 8.9%). Following health care was the energy sector, losing $1.4 billion in assets in October. Like health care, energy has been an underperformer this year relative to sector peers, ranking last in YTD performance with a gain of only 8.3%, as of October 31. Oil prices, which are highly correlated with energy sector performance, have largely slid this year as global demand, particularly in China, has slowed meaningfully.
Industrials and Real Estate Top Monthly Sector Inflows
Trailing one-month Net Asset Flows across Morningstar Sectors (AUM, $ Billions)
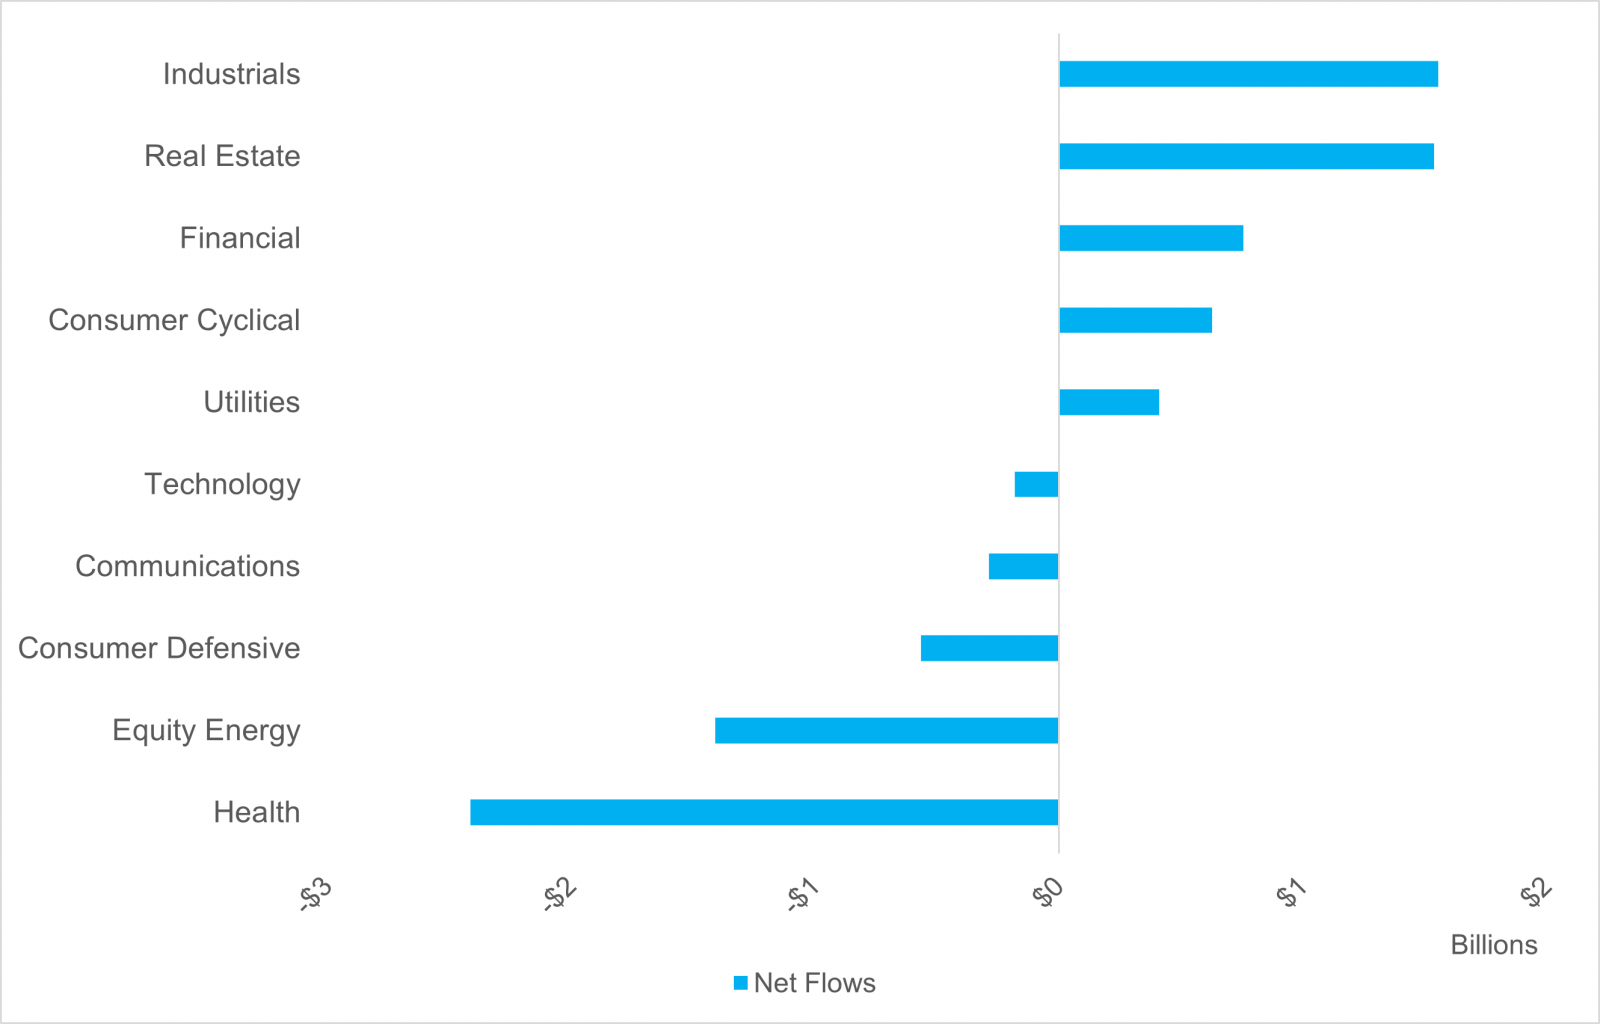
- Source: LPL Research, Morningstar Direct, 11/19/24
Disclosures: Indexes are unmanaged and cannot be invested in directly. Past performance is no guarantee of future results.
When comparing the latest LPL Research Strategic and Tactical Asset Allocation Committee (STAAC) views with the October flows data, there are a number of similarities. The top asset class by inflows in October was large blend equities. The STAAC has a slight overweight to large-cap equities over small, with the tilt coming more from large growth equities than large value. While large caps are more expensive than small caps from a valuation perspective, earnings power and quality, coupled with impressive technicals, outweigh their relatively steep valuations. Following large blend equities, were intermediate core bonds. In fixed income, the STAAC maintains a neutral duration view, favoring core fixed income broadly over cash, as the risk-return trade-off is attractive relative to history. From a sector perspective, the STAAC is overweight the top sector by inflows, industrials, as defense spending, onshoring, and artificial intelligence (AI) data center build all remain key tailwinds for the sector. The STAAC remains neutral on the top sector by outflows, health care, although the relative trend has been negative given election-related policy risk and a double-digit decline in Eli Lilly shares (LLY).
- Important Disclosures
- This material is for general information only and is not intended to provide specific advice or recommendations for any individual. There is no assurance that the views or strategies discussed are suitable for all investors. To determine which investment(s) may be appropriate for you, please consult your financial professional prior to investing.
- Investing involves risks including possible loss of principal. No investment strategy or risk management technique can guarantee return or eliminate risk.
- Indexes are unmanaged and cannot be invested into directly. Index performance is not indicative of the performance of any investment and does not reflect fees, expenses, or sales charges. All performance referenced is historical and is no guarantee of future results.
- This material was prepared by LPL Financial, LLC. All information is believed to be from reliable sources; however LPL Financial makes no representation as to its completeness or accuracy.
- Unless otherwise stated LPL Financial and the third party persons and firms mentioned are not affiliates of each other and make no representation with respect to each other. Any company names noted herein are for educational purposes only and not an indication of trading intent or a solicitation of their products or services.
- Asset Class Disclosures –
- International investing involves special risks such as currency fluctuation and political instability and may not be suitable for all investors. These risks are often heightened for investments in emerging markets.
- Bonds are subject to market and interest rate risk if sold prior to maturity.
- Municipal bonds are subject and market and interest rate risk and potentially capital gains tax if sold prior to maturity. Interest income may be subject to the alternative minimum tax. Municipal bonds are federally tax-free but other state and local taxes may apply.
- Preferred stock dividends are paid at the discretion of the issuing company. Preferred stocks are subject to interest rate and credit risk. They may be subject to a call features.
- Alternative investments may not be suitable for all investors and involve special risks such as leveraging the investment, potential adverse market forces, regulatory changes and potentially illiquidity. The strategies employed in the management of alternative investments may accelerate the velocity of potential losses.
- Mortgage backed securities are subject to credit, default, prepayment, extension, market and interest rate risk.
- High yield/junk bonds (grade BB or below) are below investment grade securities, and are subject to higher interest rate, credit, and liquidity risks than those graded BBB and above. They generally should be part of a diversified portfolio for sophisticated investors.
- Precious metal investing involves greater fluctuation and potential for losses.
- The fast price swings of commodities will result in significant volatility in an investor's holdings.
- This research material has been prepared by LPL Financial LLC.
- Not Insured by FDIC/NCUA or Any Other Government Agency | Not Bank/Credit Union Deposits or Obligations | Not Bank/Credit Union Guaranteed | May Lose Value
- For Public Use – Tracking: #660414