10.23.25 Recent High-Risk Rally Challenges Active Managers
What Has Separated Winning Stocks From Losing Stocks in Recent Periods?
In a word, risk. High-risk stocks have been in favor with investors in recent periods. One way to measure risk is with market beta, a statistic that indicates how volatile an investment is compared to a market index. In theory, a stock with a beta of 1.5 would have 50% more risk than the market index. Stocks with high betas would be expected to outperform the equity market when the equity market is rising and underperform when the equity market is declining. The last six months have mirrored the last three years, with U.S. equity indexes advancing and the highest risk stocks dramatically outperforming lower risk stocks. In the table “U.S. Equity Returns by Risk (Beta) and Size (Market Cap),” stocks are grouped into quintiles: Quintile 1 includes stocks in the highest 20% of beta, while Quintile 5 includes stocks in the lowest 20% of beta. Over the last six months, the highest beta large- and mid-cap stocks returned 66.3% while the lowest beta large- and mid-cap stocks actually declined. High-beta stocks have also strongly outperformed over the last three years, and this has been the case across large, mid, and small cap stocks.
U.S. Equity Returns by Risk (Beta) and Size (Market Cap)
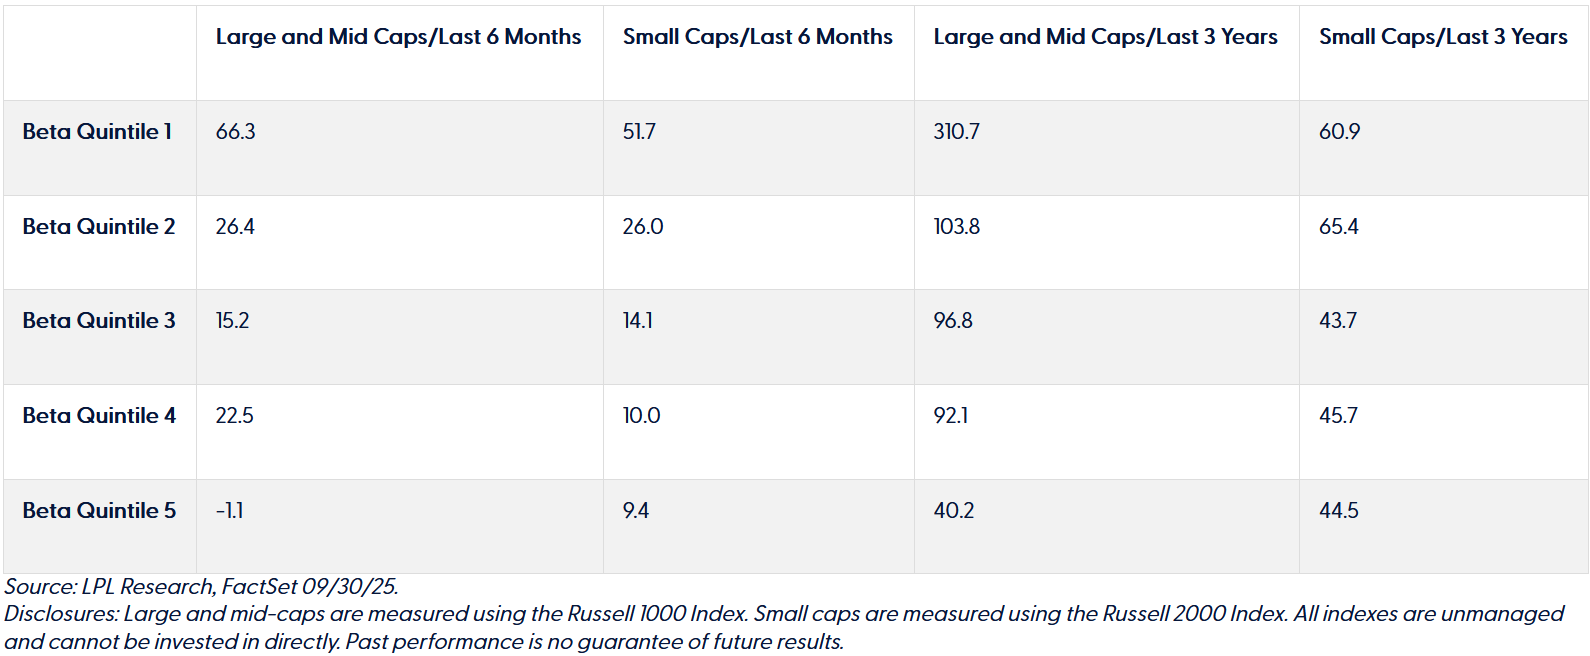
- Source: LPL Research, FactSet 09/30/25.
- Disclosures: Large and mid-caps are measured using the Russell 1000 Index. Small caps are measured using the Russell 2000 Index. All indexes are unmanaged and cannot be invested in directly. Past performance is no guarantee of future results.
The Recent Outperformance of High-Beta Stocks Is at Historically Extreme Levels
In the chart “Three-Year Annualized Return Difference Between High and Low Beta Stocks,” we plotted the return difference between high-beta stocks and low-beta stocks back to 1963. We used data from noted financial scholar Kenneth French and adjusted for company size by taking an average of high-beta stock returns and low-beta stock returns across quintiles of company size (market capitalization). Highlighted in the chart is thus the difference in return of high-beta stocks compared to low-beta stocks on a three-year annualized basis, moving throughout time. In recent months, the level of outperformance among high-beta stocks has surpassed even those observed during the 1999–2000 bull market fueled largely by speculative technology stocks. Once high-beta stocks peak, as they did in early 2000, they have often suffered steep declines. Though not shown, the recent five-year return differences are also at historic highs.
Three-Year Annualized Return Difference Between High and Low Beta Stocks
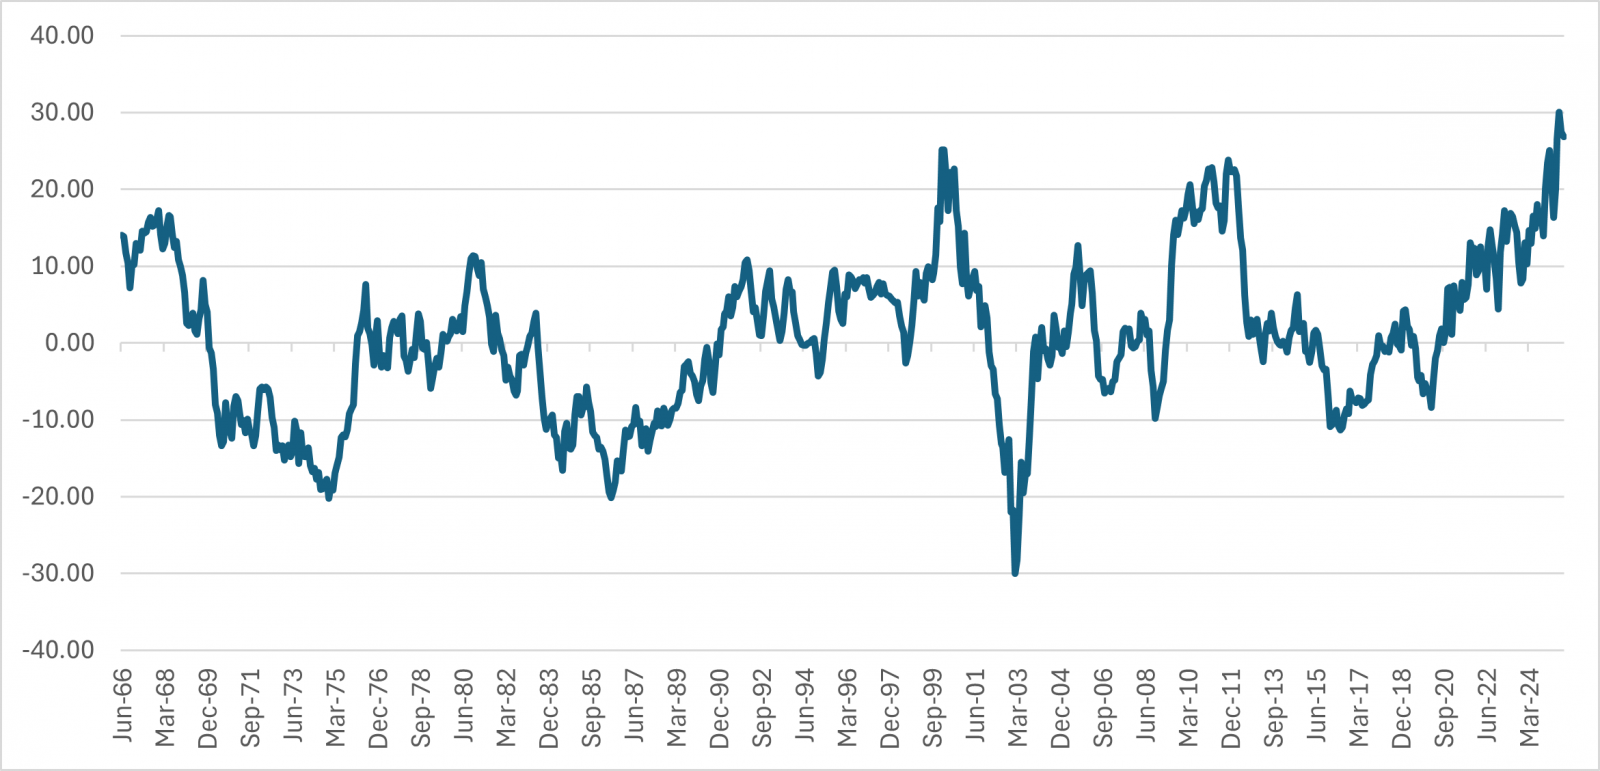
- Source: LPL Research, Kenneth French data library, 08/31/25 https://mba.tuck.dartmouth.edu/pages/faculty/ken.french/data_library.html
- Disclosures: Past performance is no guarantee of future results.
Active Managers in Strongly Advancing Markets
We recently updated our study that tracks how well active management is performing as a whole and when broken out according to asset classes and time periods. The study covers 20 years of history of actively managed mutual funds and assigns benchmarks to funds using size- and style-specific asset classes. Our research shows that active equity managers, as a group, often struggle to keep up with market indexes during sharply rising market environments. Within U.S. equity asset classes, we find active managers are prone to underperformance during three-year periods when their style-specific benchmark sharply advances. As shown on the far-right bar in the chart below, only 33% of actively managed funds outperformed their designated benchmark when that benchmark had returns above 20%. On a positive note, U.S. equity funds fared relatively well during market declines, with nearly 60% outperforming their designated benchmark when that benchmark had negative returns.
Percent (%) of Actively Managed Funds Outperforming the Benchmarks
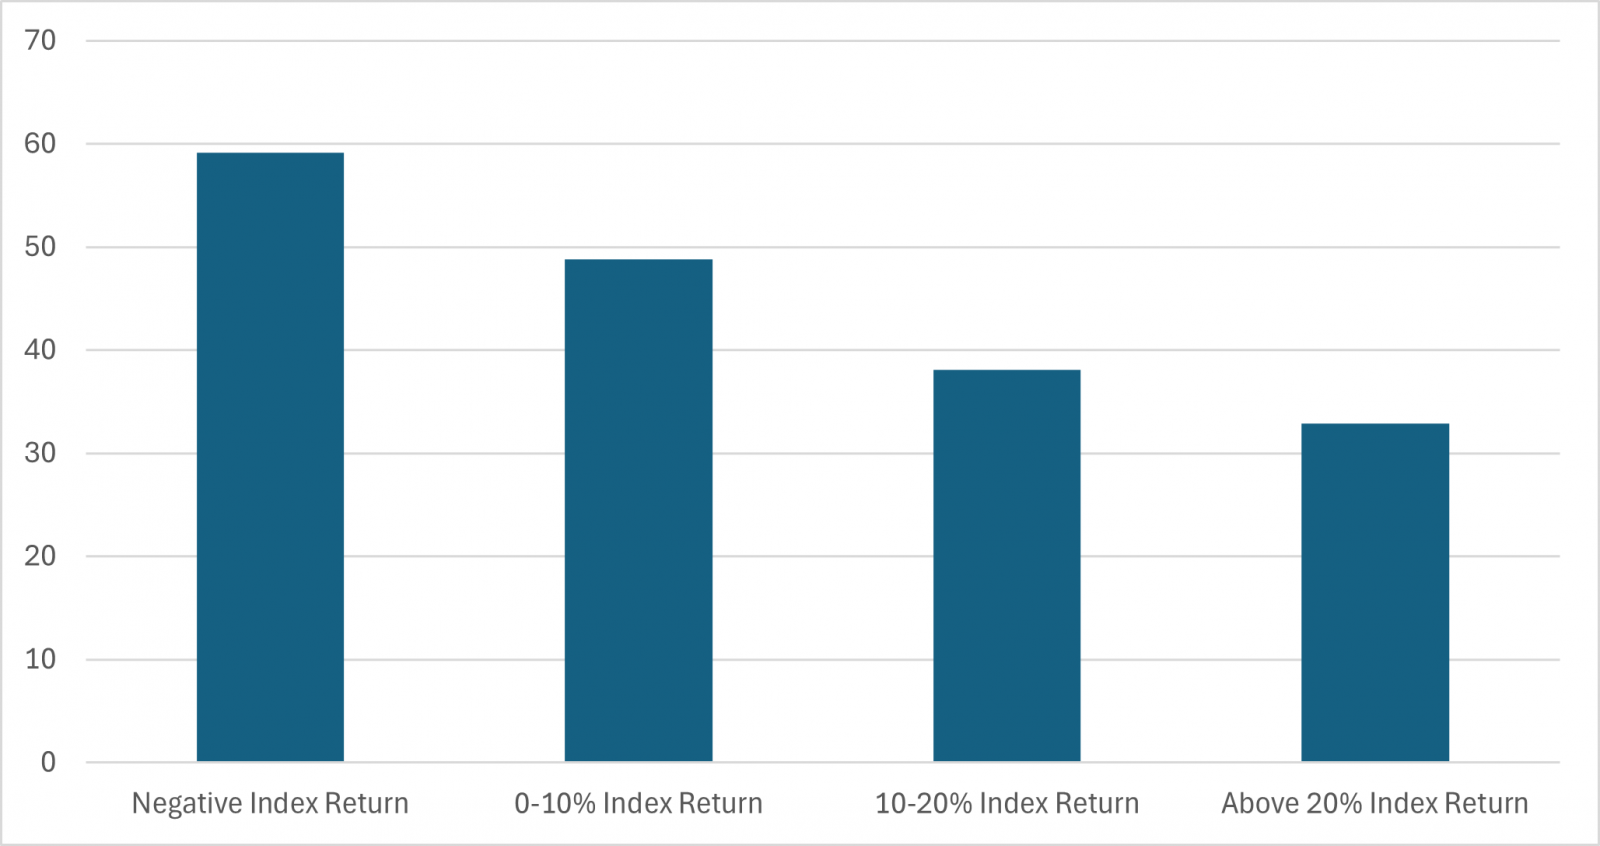
- Source: LPL Research, FactSet. Time periods are overlapping three-year periods constructed between 01/1/05 and 09/30/25.
- Disclosures: Past performance is no guarantee of future results.
The Unique Challenge of the High-Beta Rally
Generally speaking, in order to outperform over the last three years, a fund would likely need to hold investments in high-beta stocks. However, as a general tendency, active managers tend to de-emphasize high-beta stocks. In the table below, we show the beta profiles of U.S. equity mutual funds according to their size- and style-specific asset classes. In three of the four asset classes, the average actively managed fund has a beta below one, indicating that the “average” fund has a more conservative portfolio than the index assigned to that category. There may still be certain funds within a given category taking greater risk. However, in three of the four instances, the number of funds with a beta above one is well under half of the funds in that asset class. We also examined how many funds had a beta above 1.4, chosen because it is roughly the current cut-off for the second quintile of beta within the broad Russell 3000 Index. A very small number of funds take this level of risk, and they were all within the large growth asset class.
Beta Profiles of U.S. Equity Mutual Funds
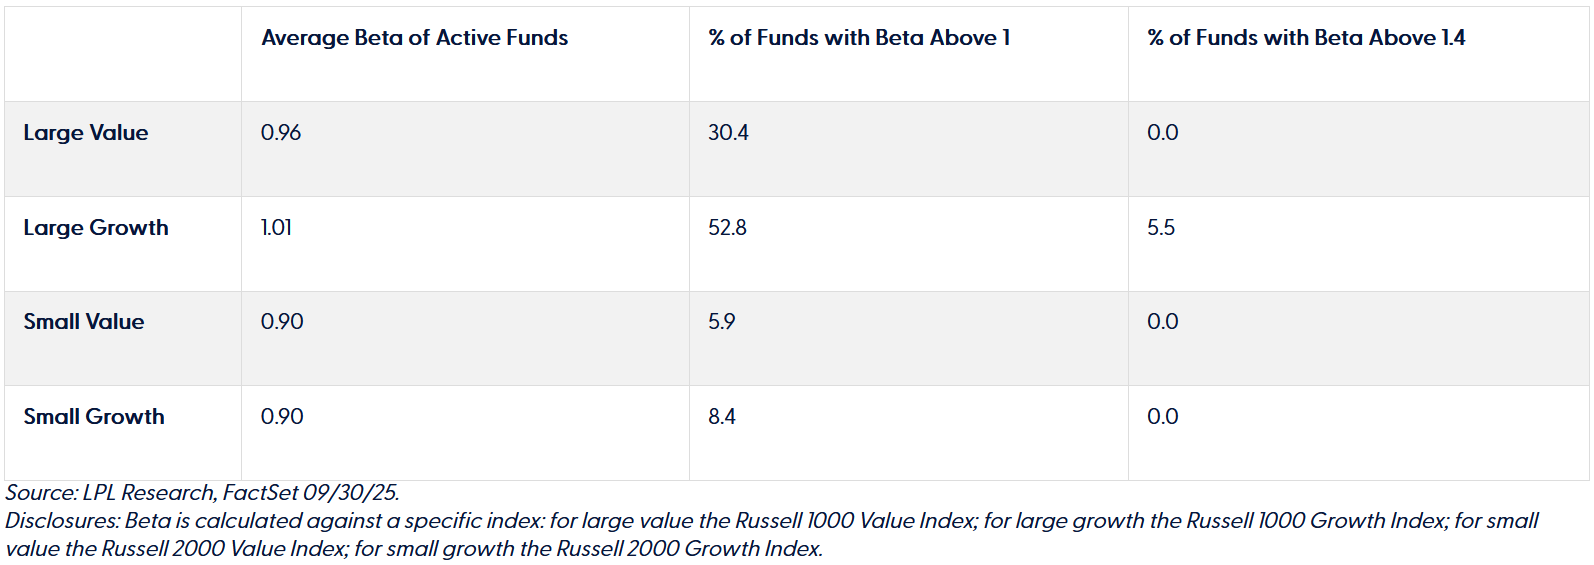
- Source: LPL Research, FactSet 09/30/25.
- Disclosures: Beta is calculated against a specific index: for large value the Russell 1000 Value Index; for large growth the Russell 1000 Growth Index; for small value the Russell 2000 Value Index; for small growth the Russell 2000 Growth Index.
High-Beta Stocks Do Not Reside in Just One Sector, Style, or Market Cap Segment
Betas are calculated using a statistical procedure that is indifferent to sector, style, and company size. Active managers across the style spectrum have been dealing with persistent outperformance of the highest-risk stocks.
For context related to sectors, according to FactSet:
• The technology sector is the largest portion of the high-beta quintile, accounting for 62% of the high-beta quintile by market value within the broad Russell 3000 Index
• 19% of the high-beta quintile are consumer discretionary stocks
• 7% of the high-beta quintile are industrial stocks
• 7% of the high-beta quintile are financial stocks
For context related to company size (market capitalization), according to FactSet:
• 12% of the Russell 1000 Index of large and mid-cap companies resides in the highest beta quintile
• 21% of the Russell 2000 Index of small companies resides in the highest beta quintile
For context related to size and style, according to FactSet:
• 5% of the Russell 1000 Value Index of large value companies resides in the highest beta quintile
• 19% of the Russell 1000 Growth Index of large growth companies resides in the highest beta quintile
• 17% of the Russell 2000 Value Index of small value companies resides in the highest beta quintile
• 25% of the Russell 2000 Growth Index of small growth companies resides in the highest beta quintile
The Special Challenge of Time-Period Roll-Off
Many sources allow investors to review trailing fund returns, such as returns for the trailing three- and five-year periods. Such trailing returns have beginning-and-end-point bias. When a particular time period no longer falls within the trailing time window, investors lose visibility into how a fund performed in those environments. As we approached the most recent quarter-end, some notable market downturns fell out of the trailing period calculations. For one, the early days of the COVID-19 pandemic fell out of the five-year trailing period. Additionally, the equity market declines of the spring and summer of 2022 fell out of the trailing three-year period. As a result, capital preservation provided by conservative investments during those equity market declines are less visible to investors observing three- and five-year trailing returns.
Key Takeaways
Investors reviewing fund returns as of the latest quarter-end are doing so at an extreme point in history. Never in over 60 years of history have high-risk stocks outperformed low-risk stocks by as much as they have in the recent three- and five-year trailing periods. With this in mind, here are some tangible considerations for investors:
• Making a judgment that a fund has performed well or poorly at such an extreme point in history may lead to misleading conclusions. Because of the extreme rally for high-beta stocks, the current three- and five-year trailing periods may not be indicative of a typical holding period.
• If the equity mutual funds you own are underperforming, it may be because the fund manager is taking prudent risk aligned with your own conservative risk tolerance.
• If the investments you own are outperforming, you may want to review the risk profile of your investments to make sure they align with your risk profile.
• Investors who sell underperforming funds to buy outperforming funds at this point in time may end up in a portfolio with significantly greater risk.
• One relatively simple way to escape the begin-and-end-point bias of trailing returns is to evaluate calendar year returns. For example, investors interested in returns during down markets could review fund performance for the years 2018 and 2022, when equity markets generally declined. Of course, past performance is no guarantee of future results.
- Important Disclosures
- This material is for general information only and is not intended to provide specific advice or recommendations for any individual. There is no assurance that the views or strategies discussed are suitable for all investors. To determine which investment(s) may be appropriate for you, please consult your financial professional prior to investing.
- Investing involves risks including possible loss of principal. No investment strategy or risk management technique can guarantee return or eliminate risk.
- Indexes are unmanaged and cannot be invested into directly. Index performance is not indicative of the performance of any investment and does not reflect fees, expenses, or sales charges. All performance referenced is historical and is no guarantee of future results.
- This material was prepared by LPL Financial, LLC. All information is believed to be from reliable sources; however LPL Financial makes no representation as to its completeness or accuracy.
- Unless otherwise stated LPL Financial and the third party persons and firms mentioned are not affiliates of each other and make no representation with respect to each other. Any company names noted herein are for educational purposes only and not an indication of trading intent or a solicitation of their products or services.
- Asset Class Disclosures –
- International investing involves special risks such as currency fluctuation and political instability and may not be suitable for all investors. These risks are often heightened for investments in emerging markets.
- Bonds are subject to market and interest rate risk if sold prior to maturity.
- Municipal bonds are subject and market and interest rate risk and potentially capital gains tax if sold prior to maturity. Interest income may be subject to the alternative minimum tax. Municipal bonds are federally tax-free but other state and local taxes may apply.
- Preferred stock dividends are paid at the discretion of the issuing company. Preferred stocks are subject to interest rate and credit risk. They may be subject to a call features.
- Alternative investments may not be suitable for all investors and involve special risks such as leveraging the investment, potential adverse market forces, regulatory changes and potentially illiquidity. The strategies employed in the management of alternative investments may accelerate the velocity of potential losses.
- Mortgage backed securities are subject to credit, default, prepayment, extension, market and interest rate risk.
- High yield/junk bonds (grade BB or below) are below investment grade securities, and are subject to higher interest rate, credit, and liquidity risks than those graded BBB and above. They generally should be part of a diversified portfolio for sophisticated investors.
- Precious metal investing involves greater fluctuation and potential for losses.
- The fast price swings of commodities will result in significant volatility in an investor's holdings.
- This research material has been prepared by LPL Financial LLC.
- Not Insured by FDIC/NCUA or Any Other Government Agency | Not Bank/Credit Union Deposits or Obligations | Not Bank/Credit Union Guaranteed | May Lose Value
- For Public Use – Tracking: #815343
Contact us directly should you have questions about this topic.